Immigration and Customs Enforcement (ICE) detained more than 65,000 people on the evening of August 5, 2026, the result of a surge in ICE enforcement activity in the Northern Hemisphere summer months. Cumulatively, more than 620,000 people have experienced ICE detention during the first 20 months of the Trump administration. Facility-by-facility population levels differ based on the location of the facility and how ICE uses the facility within the larger migrant detention network.
This post will start with a discussion of some national trends of detention book ins, followed by a few notes about how we think about detention, and then will end with some observations related to specific detention facilities. Data come from the “detentions” ICE case records obtained via FOIA lawsuit by The Deportation Data Project and analyzed by me. Unless otherwise specified, all statistics cited below have validity through August 5, 2026. If you are interested in an analysis of arrests, I recommend reading this post from my colleague Austin Kocher.
National ICE Detention Trends
Here’s a chart showing the national detained population every midnight over the last four years.
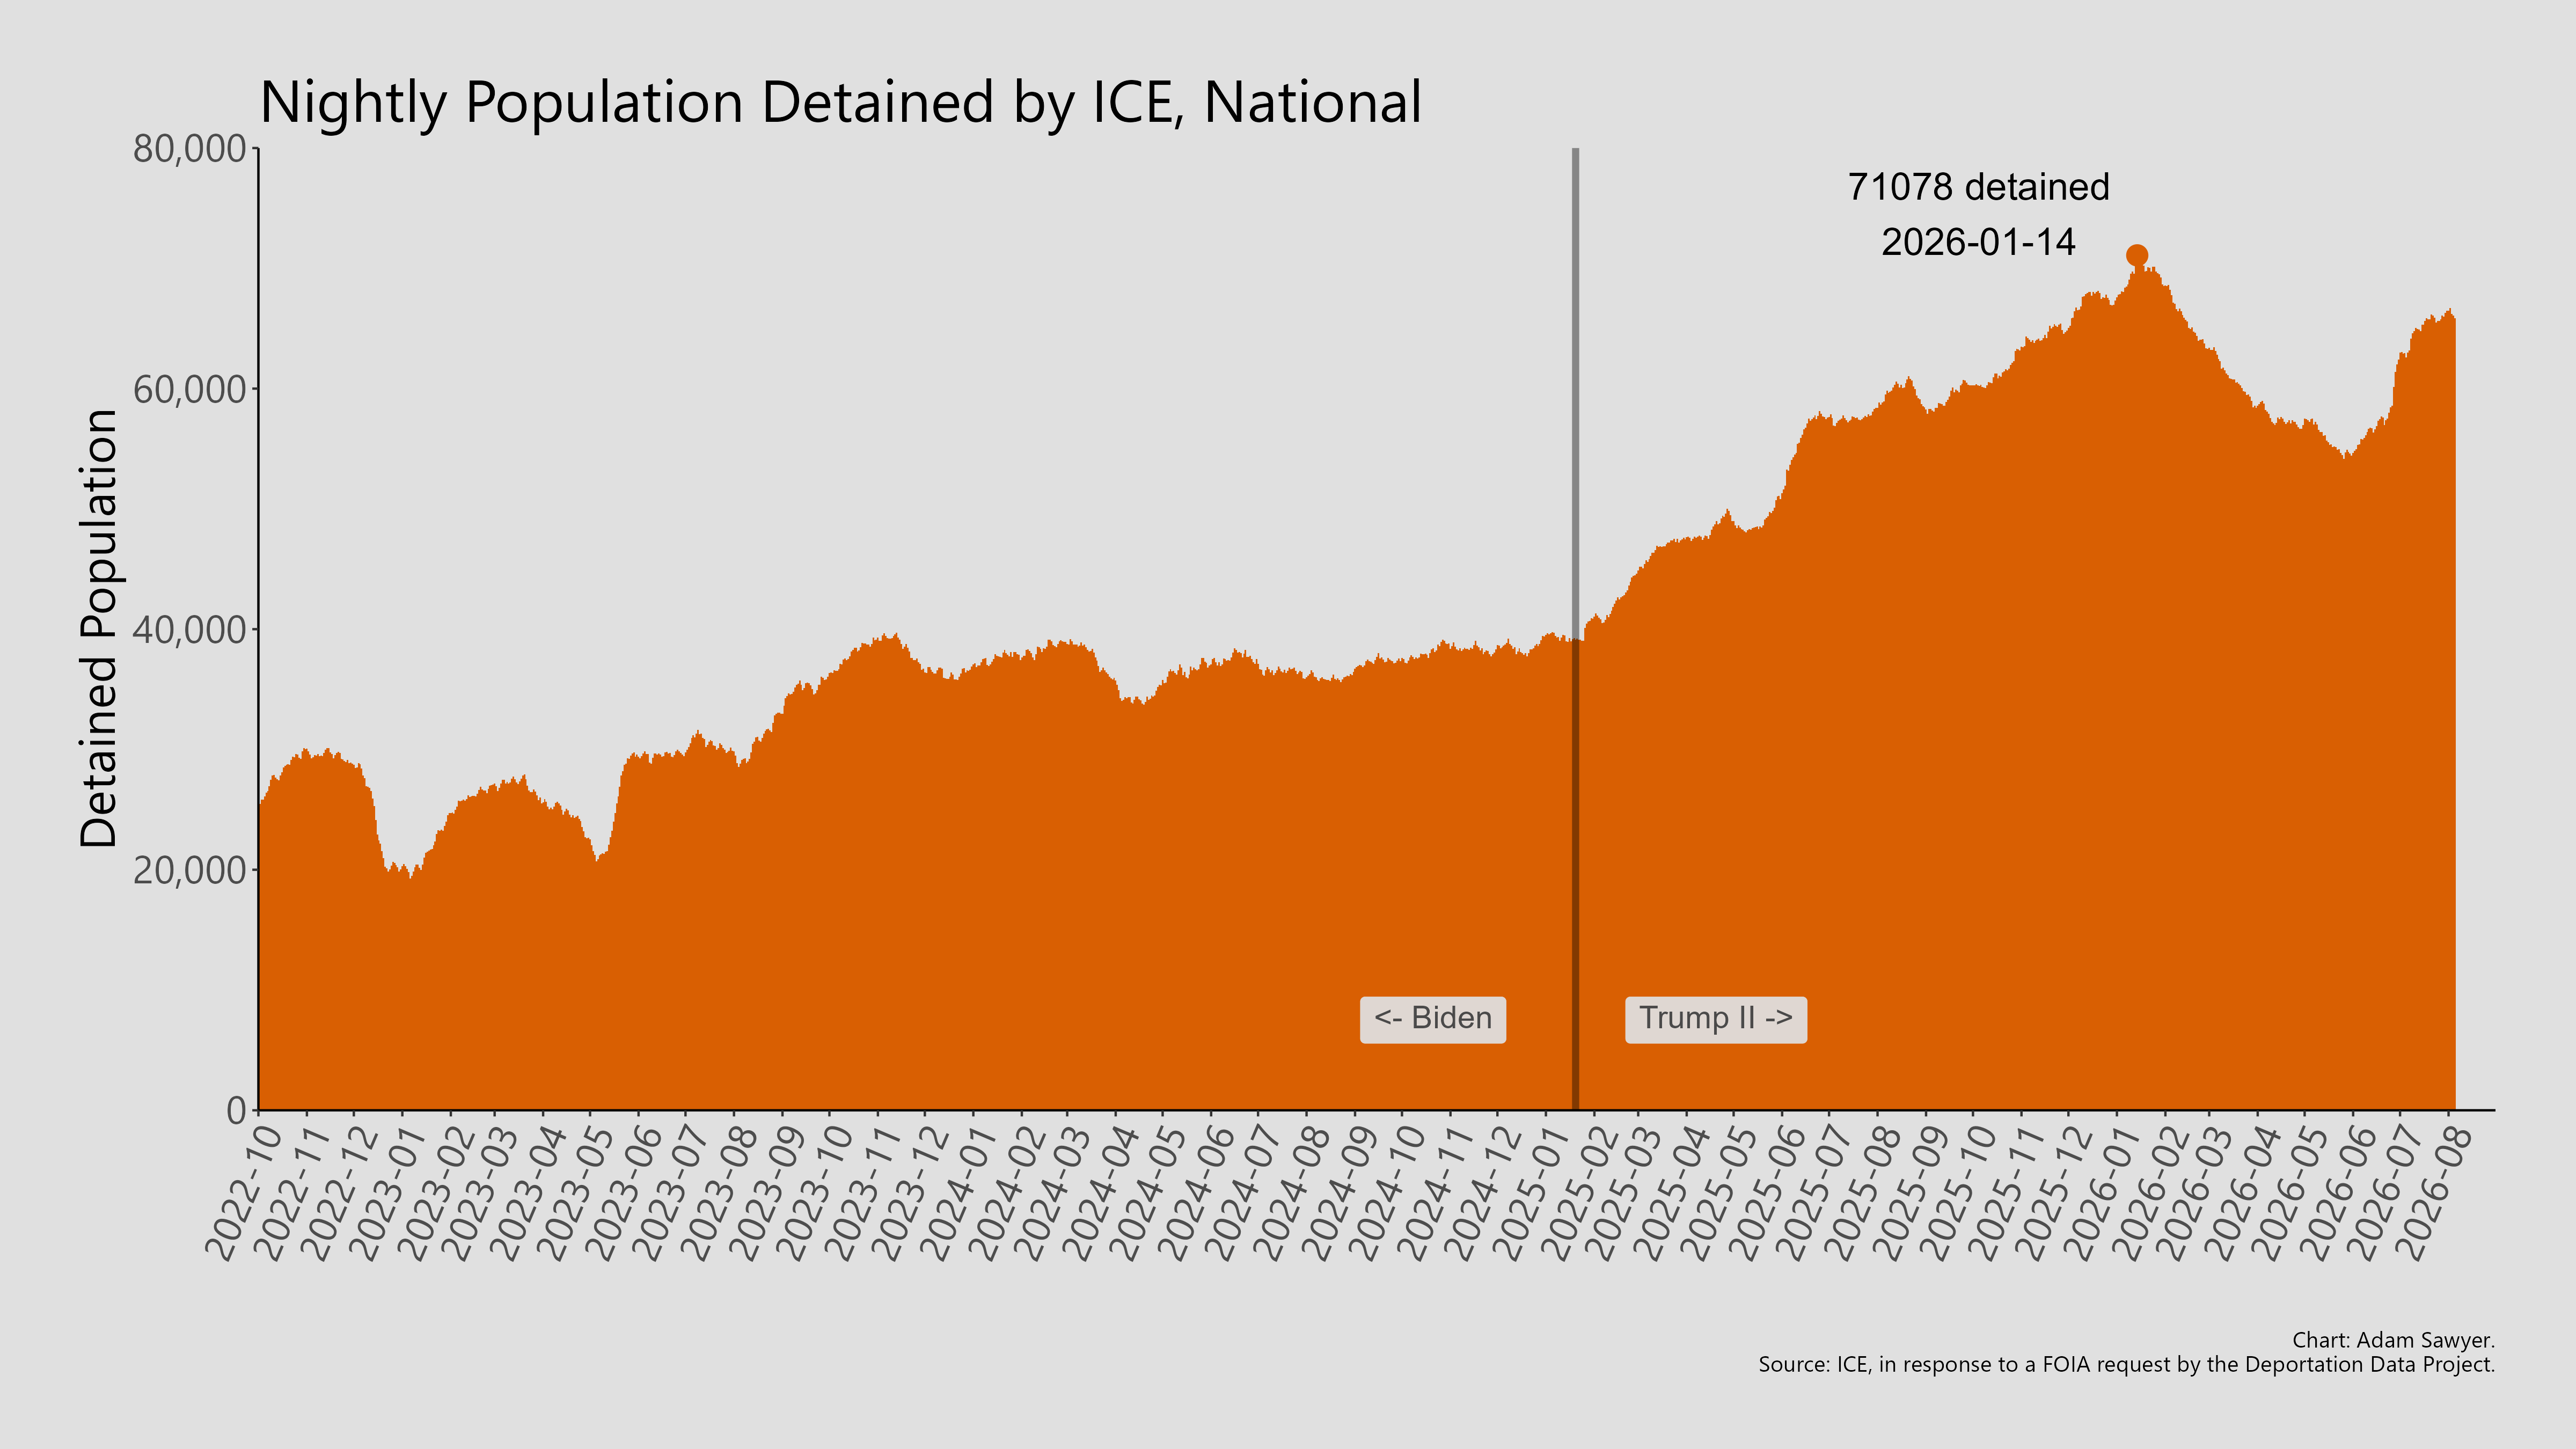
The national population detained by ICE peaked in mid-January, when 71,078 people were detained at one time, dipped during the spring months, and then surged again during the summer.1
To my mind, multiple factors may have driven the dip in national enforcement between February and late-June. Non-exhaustively, these include massive public backlash to Operation Metro Surge, protests against the ICE warehouse plan, multiple public health emergencies at the largest facility in the country, and maybe a bit of reticence by the admin to keep up the pace of immigration enforcement at the front-end of the Men’s World Cup. Regardless, the Department of Homeland Security (DHS) has carried out a general enforcement blitz since late June.
A different way to look at these trends is to compare facility population count snapshots at specific intervals in time. Here’s a table that gets at this method.
| Interval | Date | Detained Pop. |
|---|---|---|
| Comparison date | Aug. 5, 2026 | 65,861 |
| One month before | July 5, 2026 | 62,582 |
| Three months before | May 5, 2026 | 57,515 |
| Six months before | Feb. 5, 2026 | 67,757 |
| One year before | Aug. 5, 2025 | 58,947 |
| Two years before | Aug. 5, 2024 | 36,422 |
| Three years before | Aug. 5, 2023 | 28,821 |
The number of people ICE detained on August 5, 2026 was more than double the number of people detained on that exact day 3 years ago, August 5, 2023.
A drawback of looking at all of the above is that these are all counts at particular moments in time, something that can obscure the sheer magnitude of migrant detention in the United States of 2025-2026. A different question is…
How many people in total have experienced ICE detention over the last 20 months?
About 622,000 individuals have experienced ICE detention during the first 20 months of the second Trump administration.
This is an increase of around 170,000 individuals compared to my analysis earlier this year, when I found that around 450,000 people had experienced ICE detention under the Trump administration through early March 2026.
Here’s how cumulative detention looks as a graph over the entire data set that’s available.
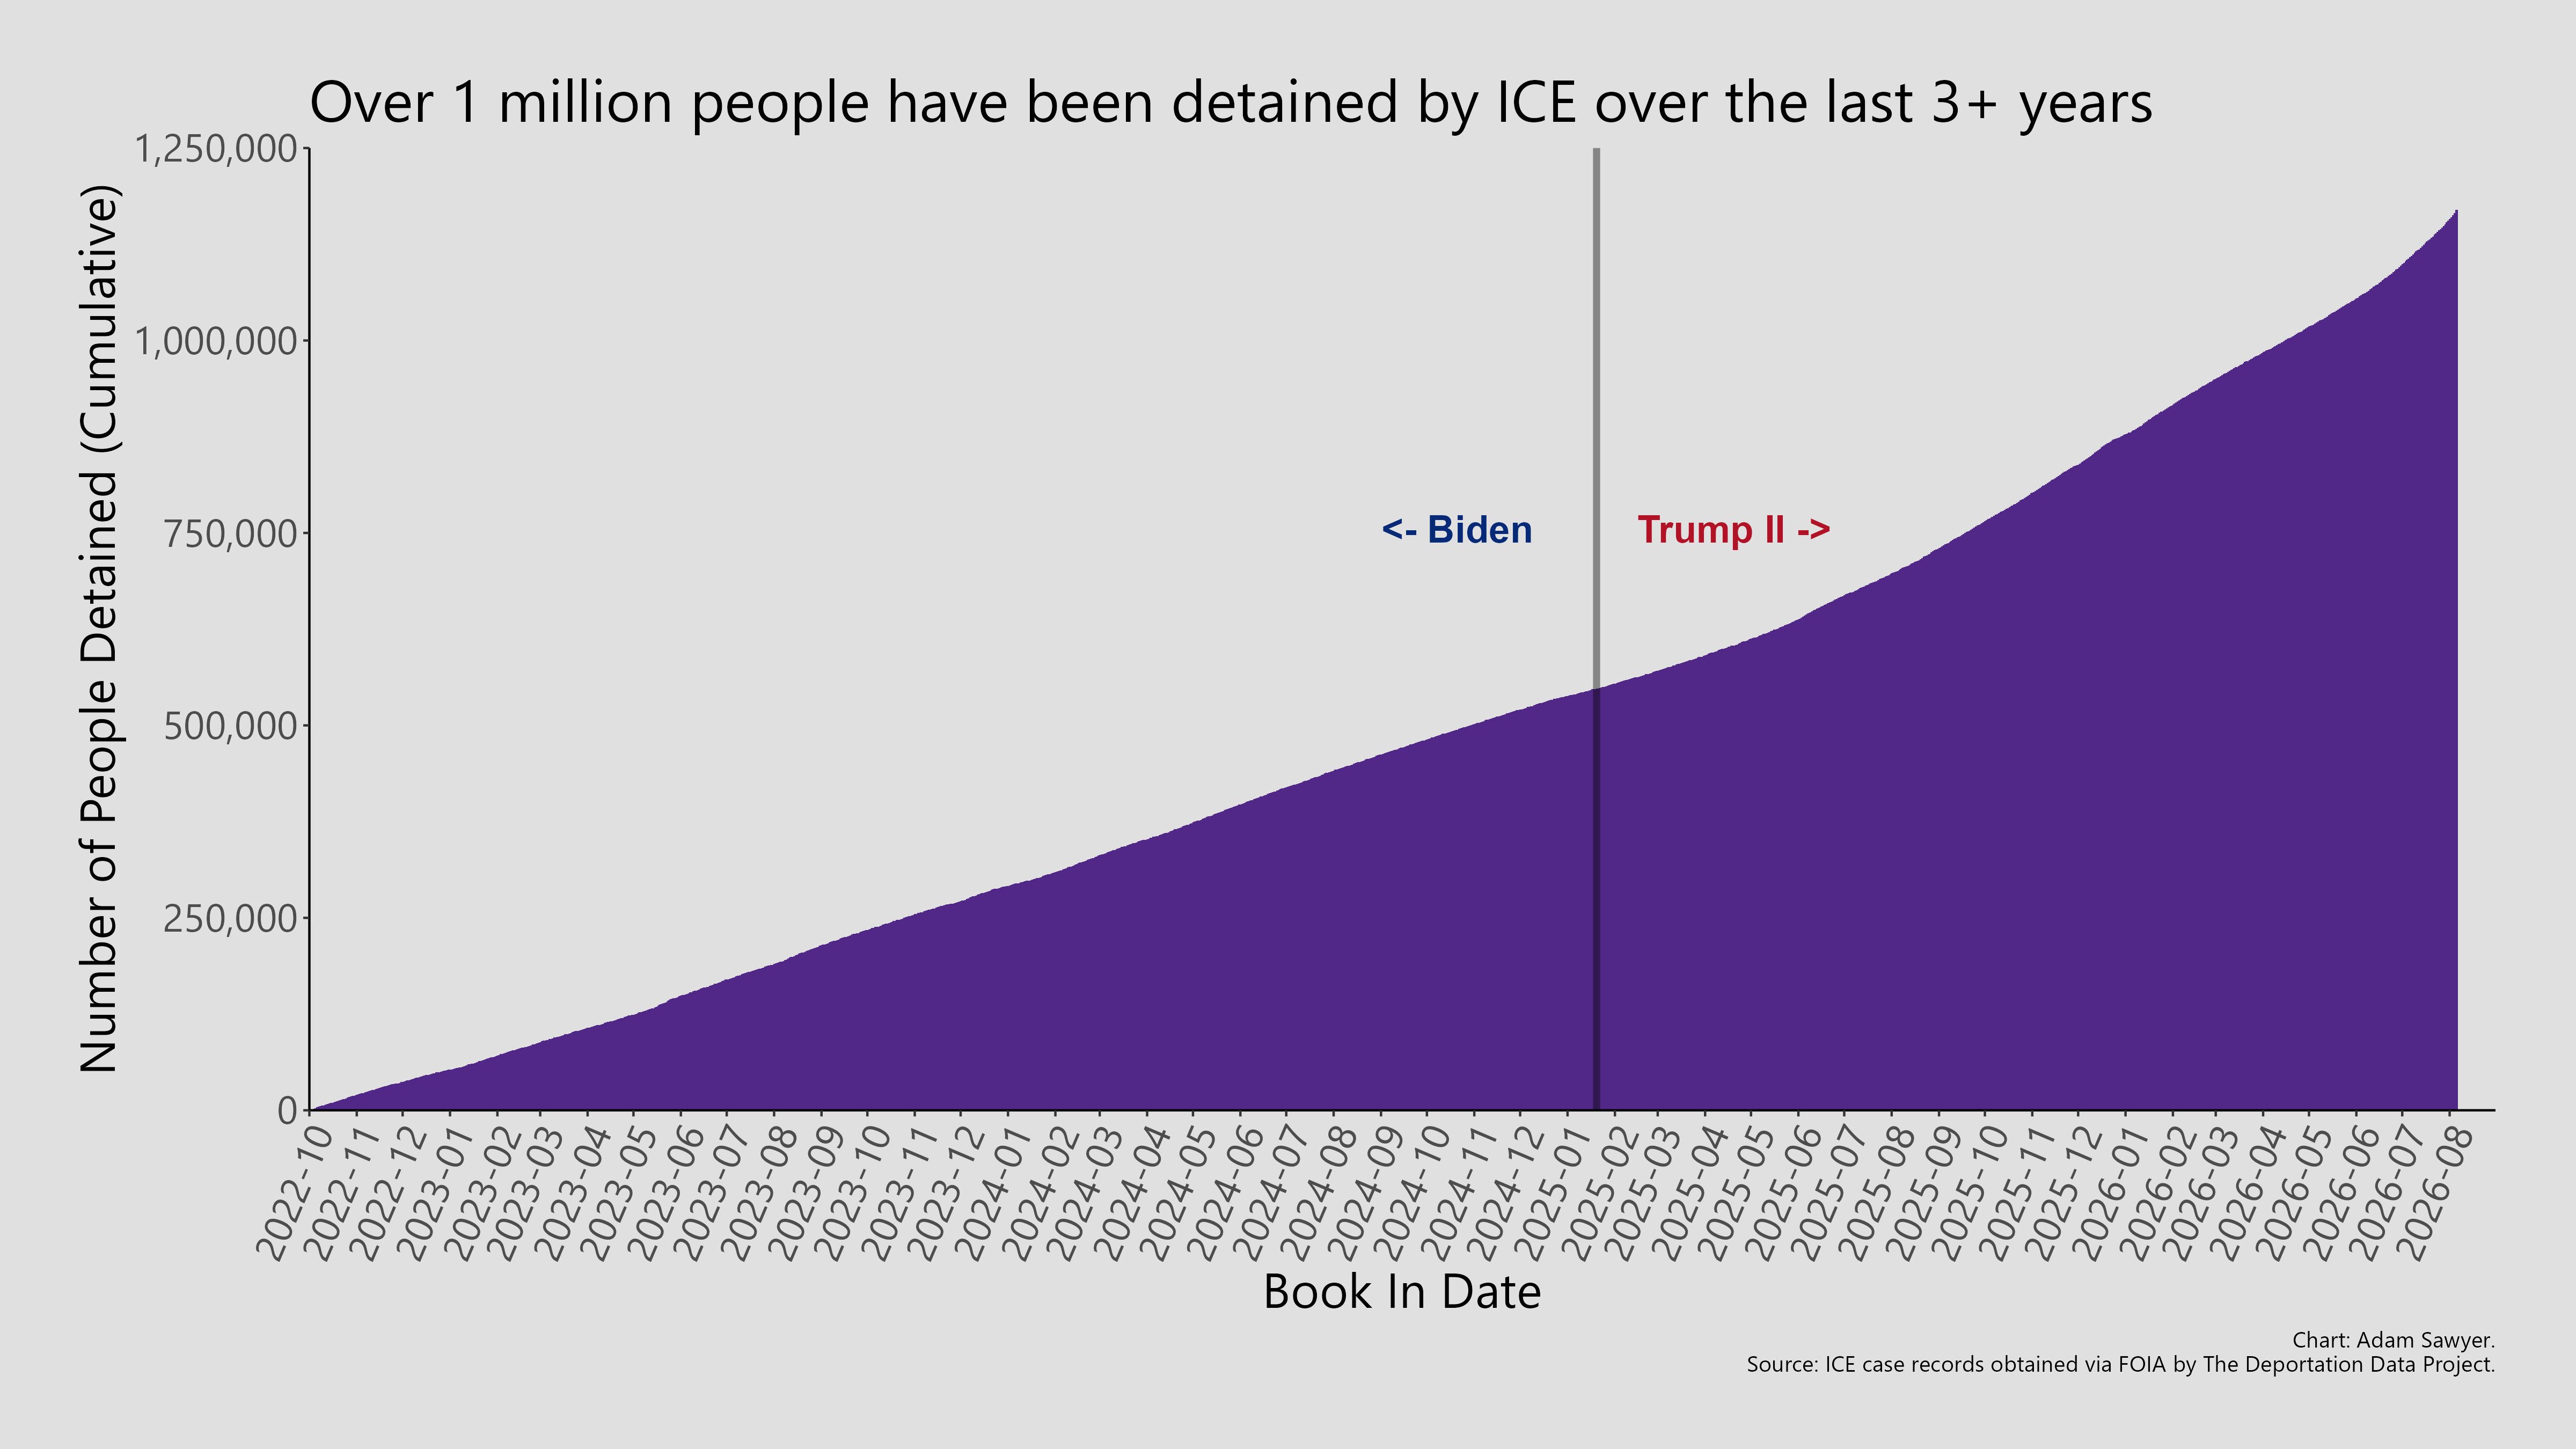
That’s nearly 1.25 million people who have experienced detention over the past 4 years. Even with the exhaustive records obtained by The Deportation Data Project, this is still likely an undercount.2
Here’s how the rate of detention book ins appears when comparing the pace of arrests during the last 28 months of the Biden administration to the first 20 months of the second Trump administration.
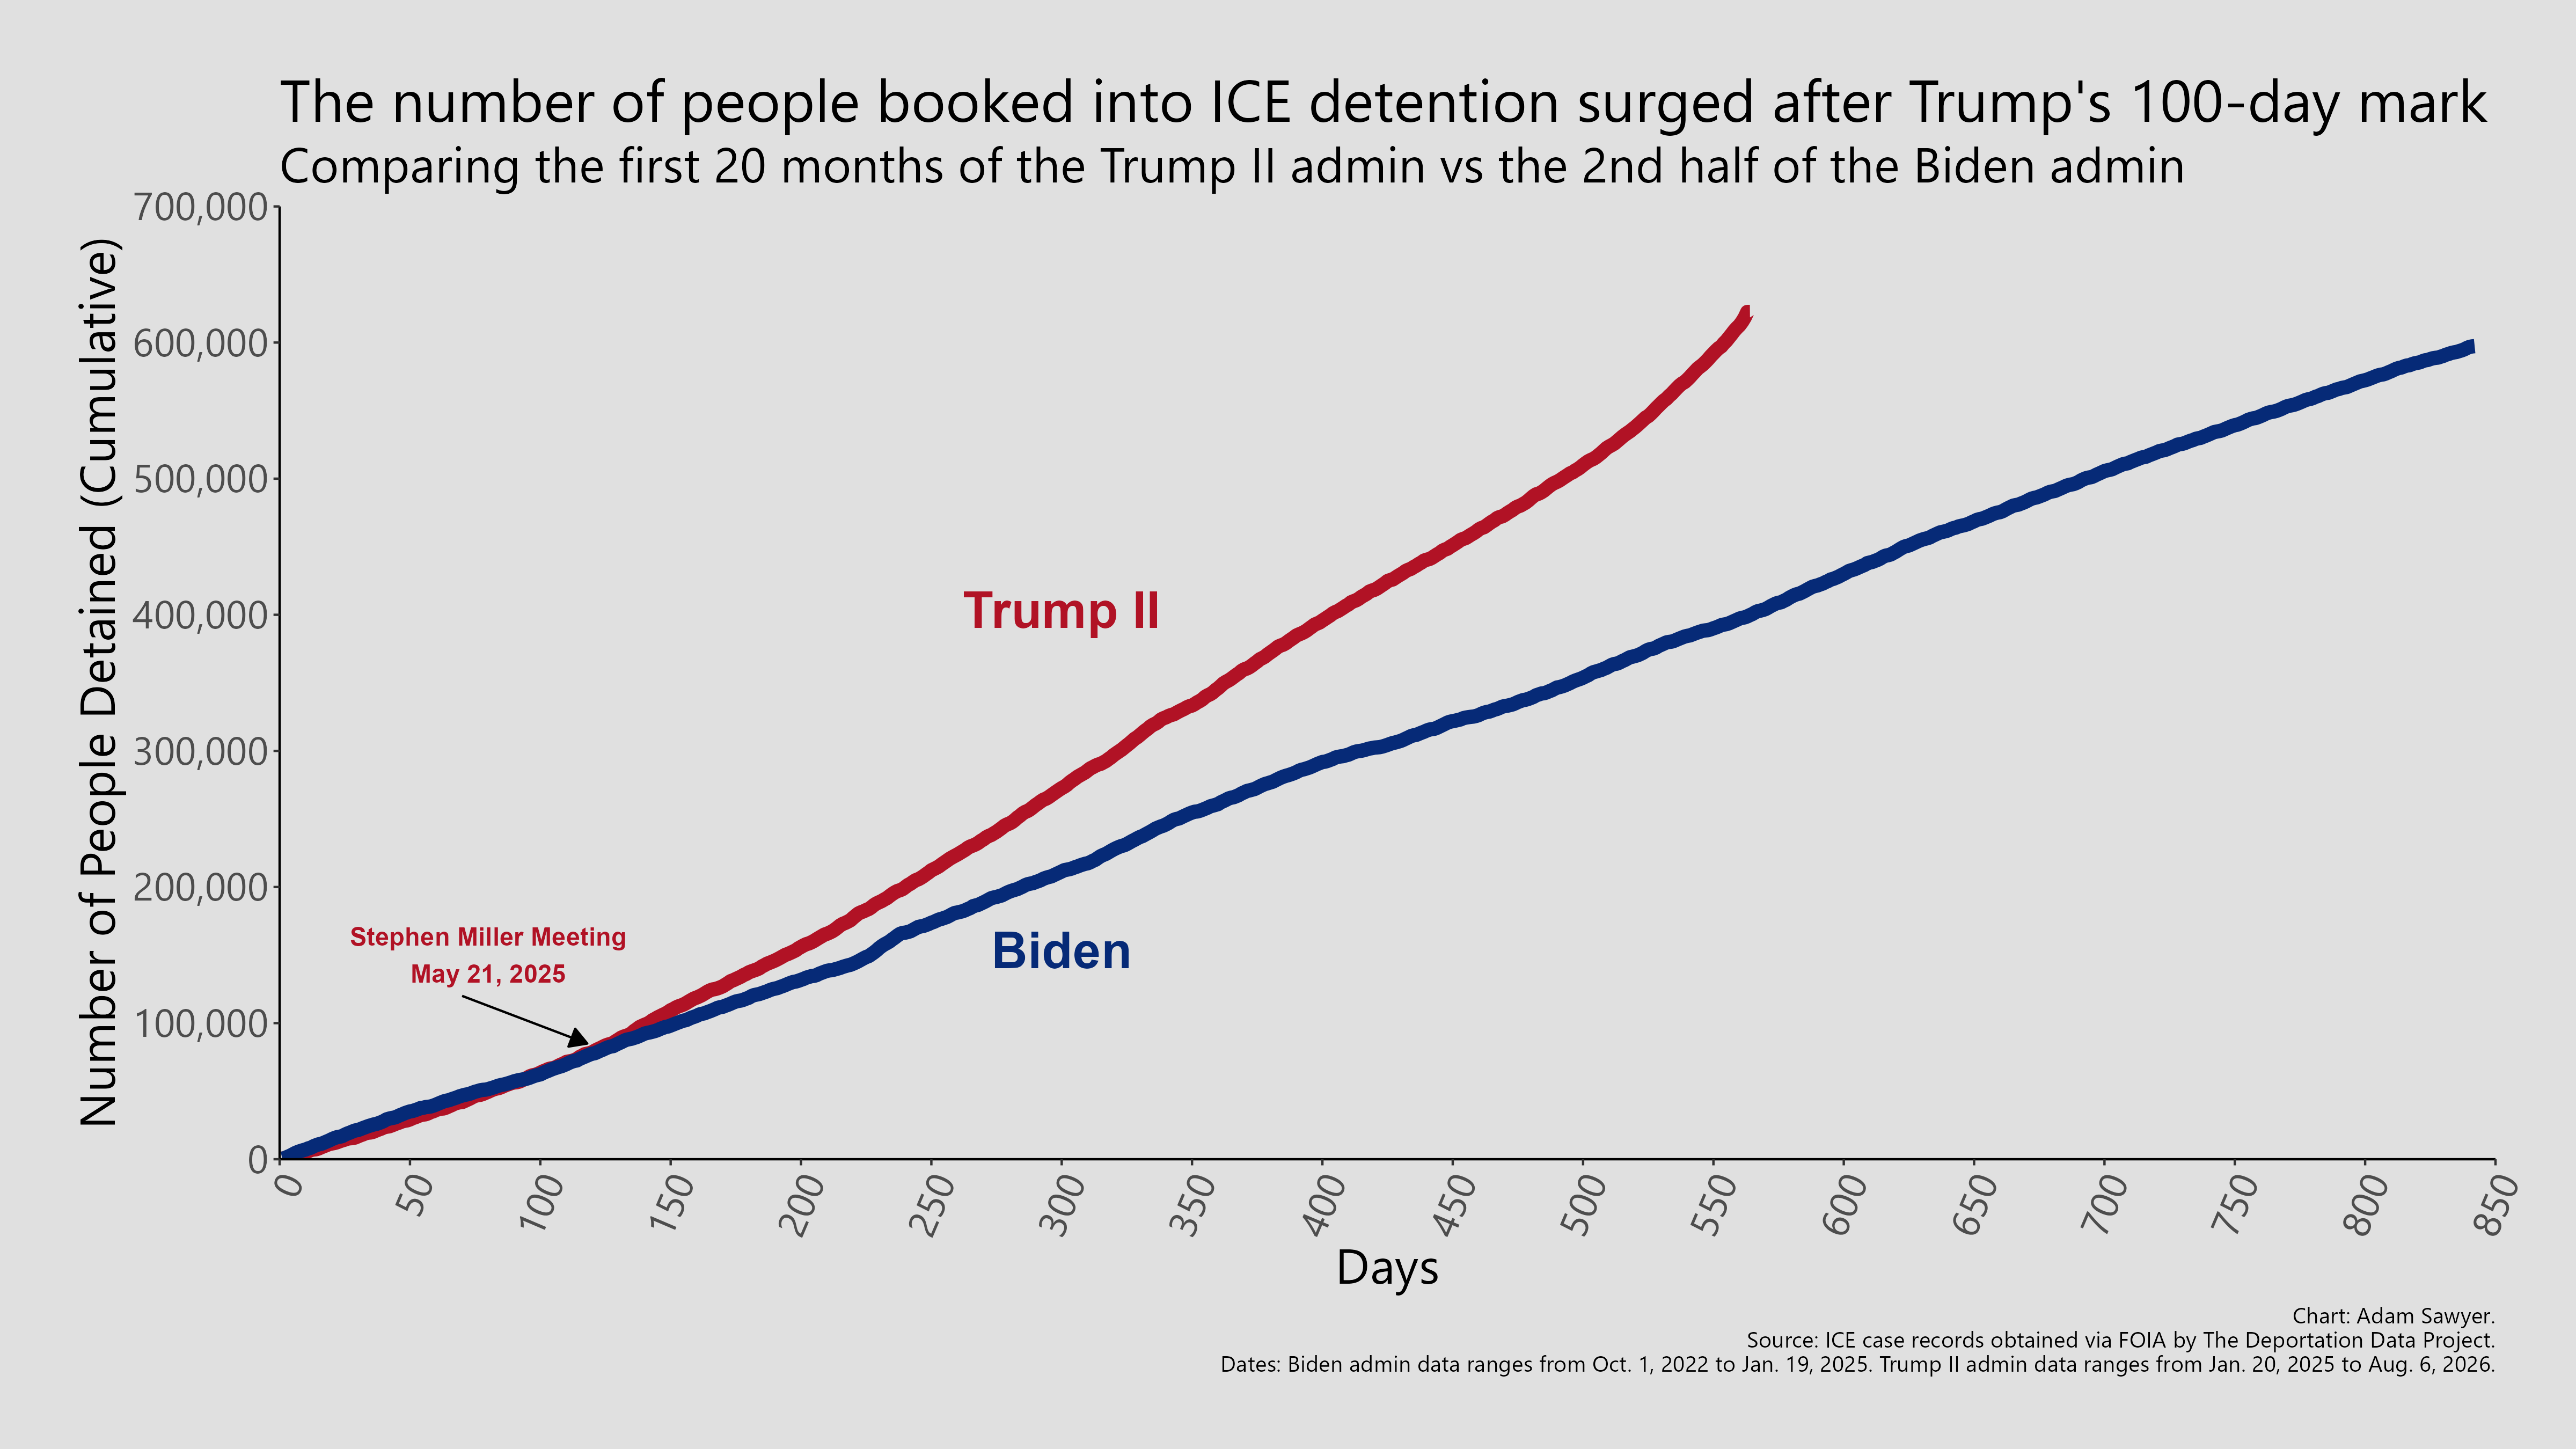
The Stephen Miller meeting on May 21, 2025 remains a pivotal moment in the second Trump administration. Pushed to achieve daily quotas of arrests, ICE accelerated the practice of taking people into custody.
One aspect of the administration’s enforcement behavior is how little it regards any kind of status short of full citizenship. The summer surge has been driven in part by the arrest of people who had some level of authorization to study, work, and live here until recently. To review, any non-citizen who ICE believes to be eligible for removal can be brought into immigration detention, not just people who happen to have “undocumented” status. My colleague Austin makes this point all the time. A recent strategy of the current administration is to cancel or suspend whatever authorization a person may have had (Temporary Protected Status, student visas, pending application, etc…) and then subsequently make those groups of people categorically eligible for detention, and therefore, removal. Dara Lind calls it the Great Delegalization.
ICE Detention Charts
It can be exhausting, keeping up with all of the enforcement activity taken by the current administration. But the tax-paying public deserves to know how many people ICE is detaining and where. I generated 599 charts using the detention book ins data to help address this concern, focusing on locations where ICE detains an individual overnight. You can find all of the charts sorted by State and Territory on this website.
A few observations on recent trends in the general order of how someone might experience ICE detention.3
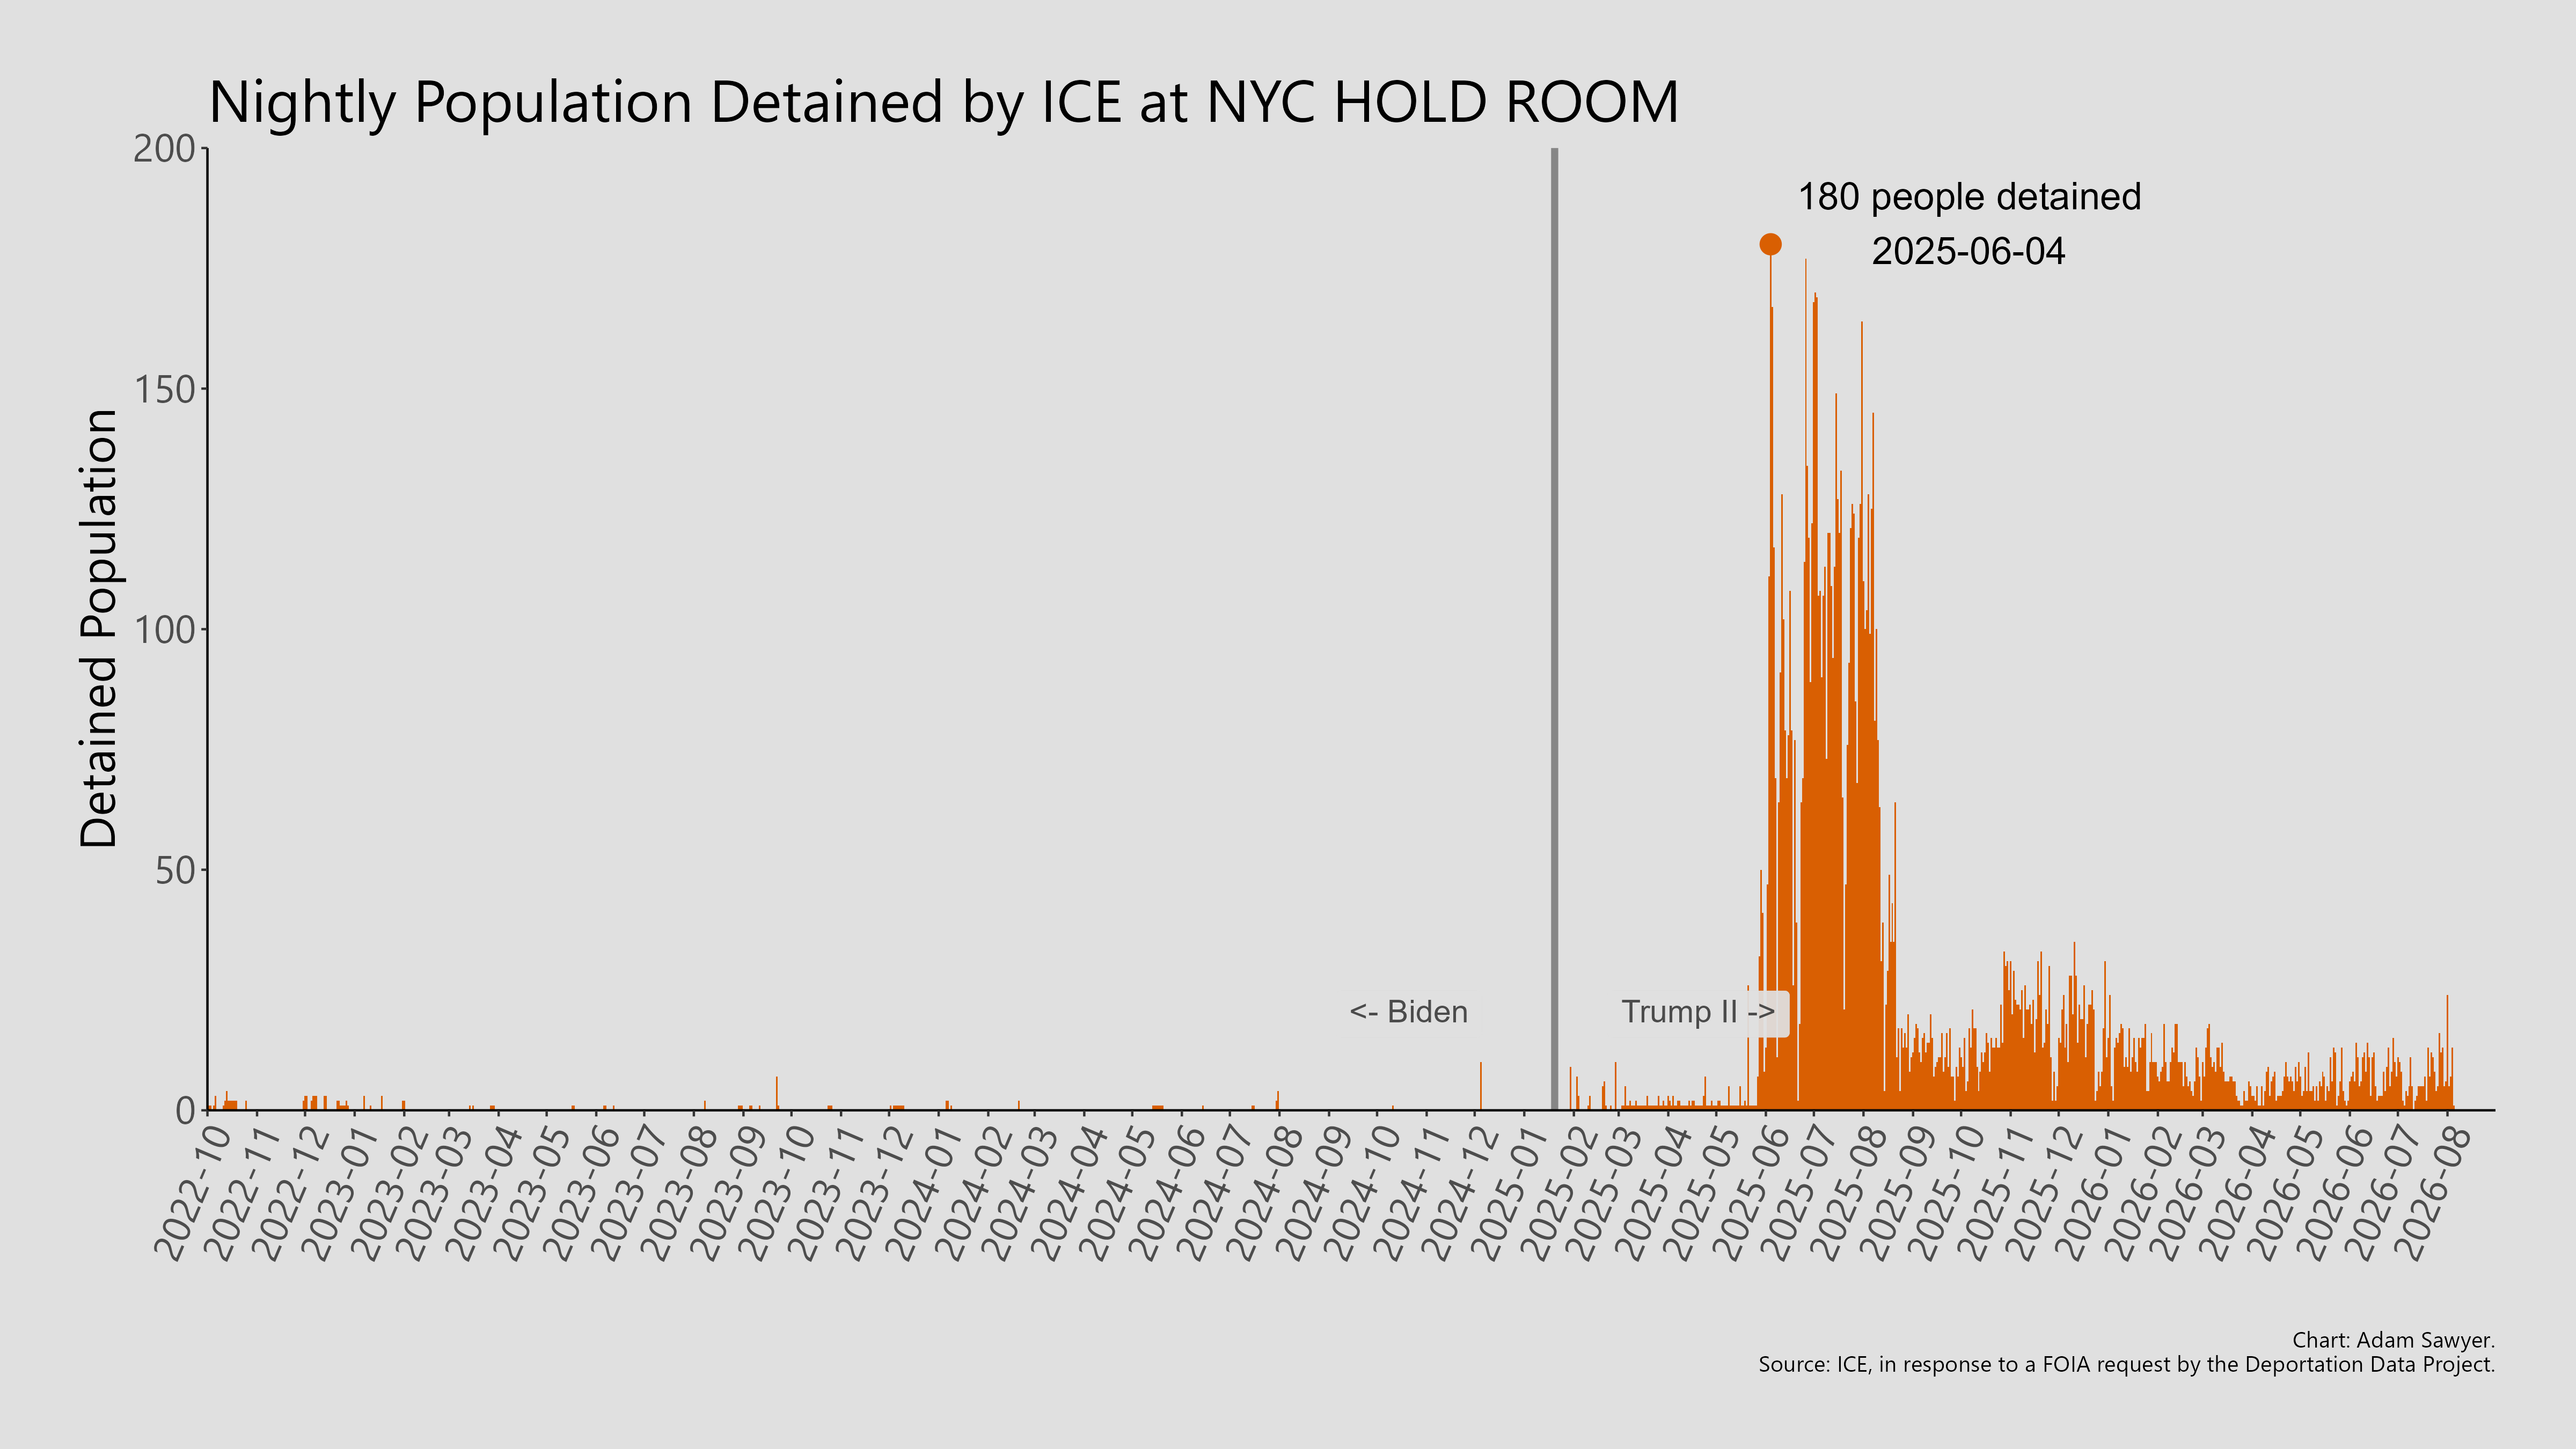
Many many more people are first booked into ICE “hold rooms” under the present administration than in previous years.
Broadview, outside downtown Chicago 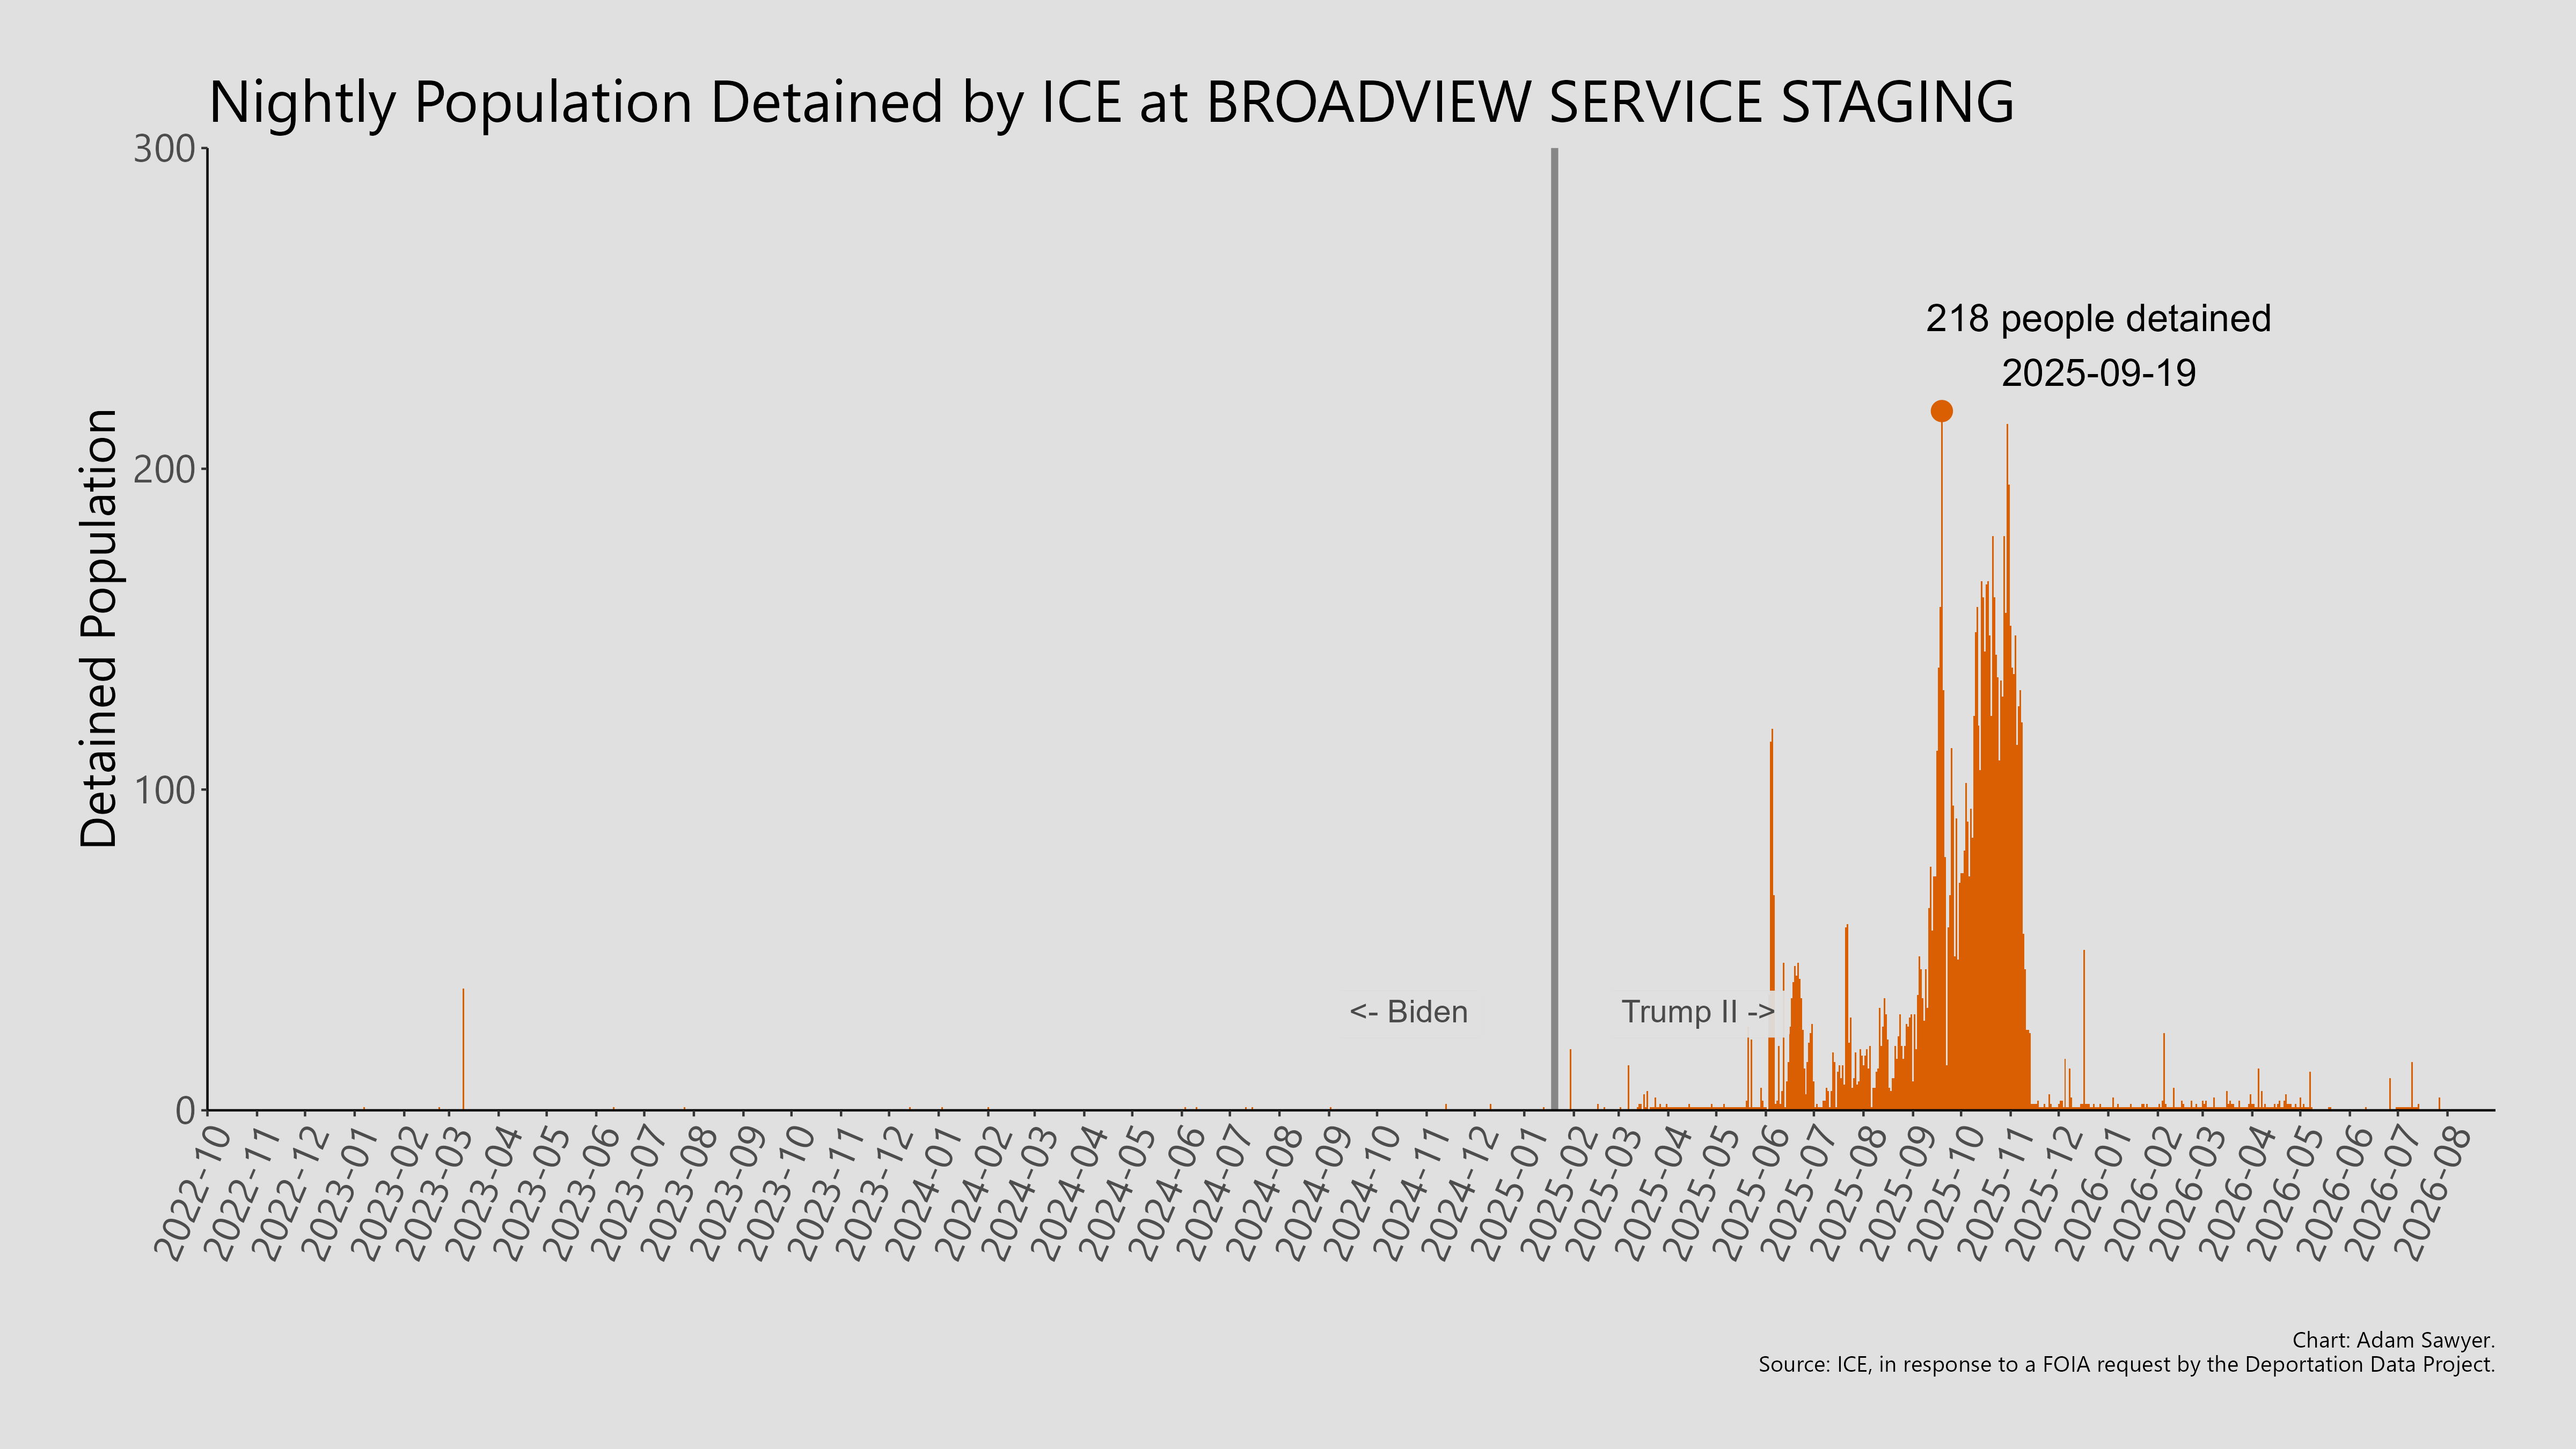
Bishop Henry Whipple Federal Building, in the Minneapolis-St. Paul metro area 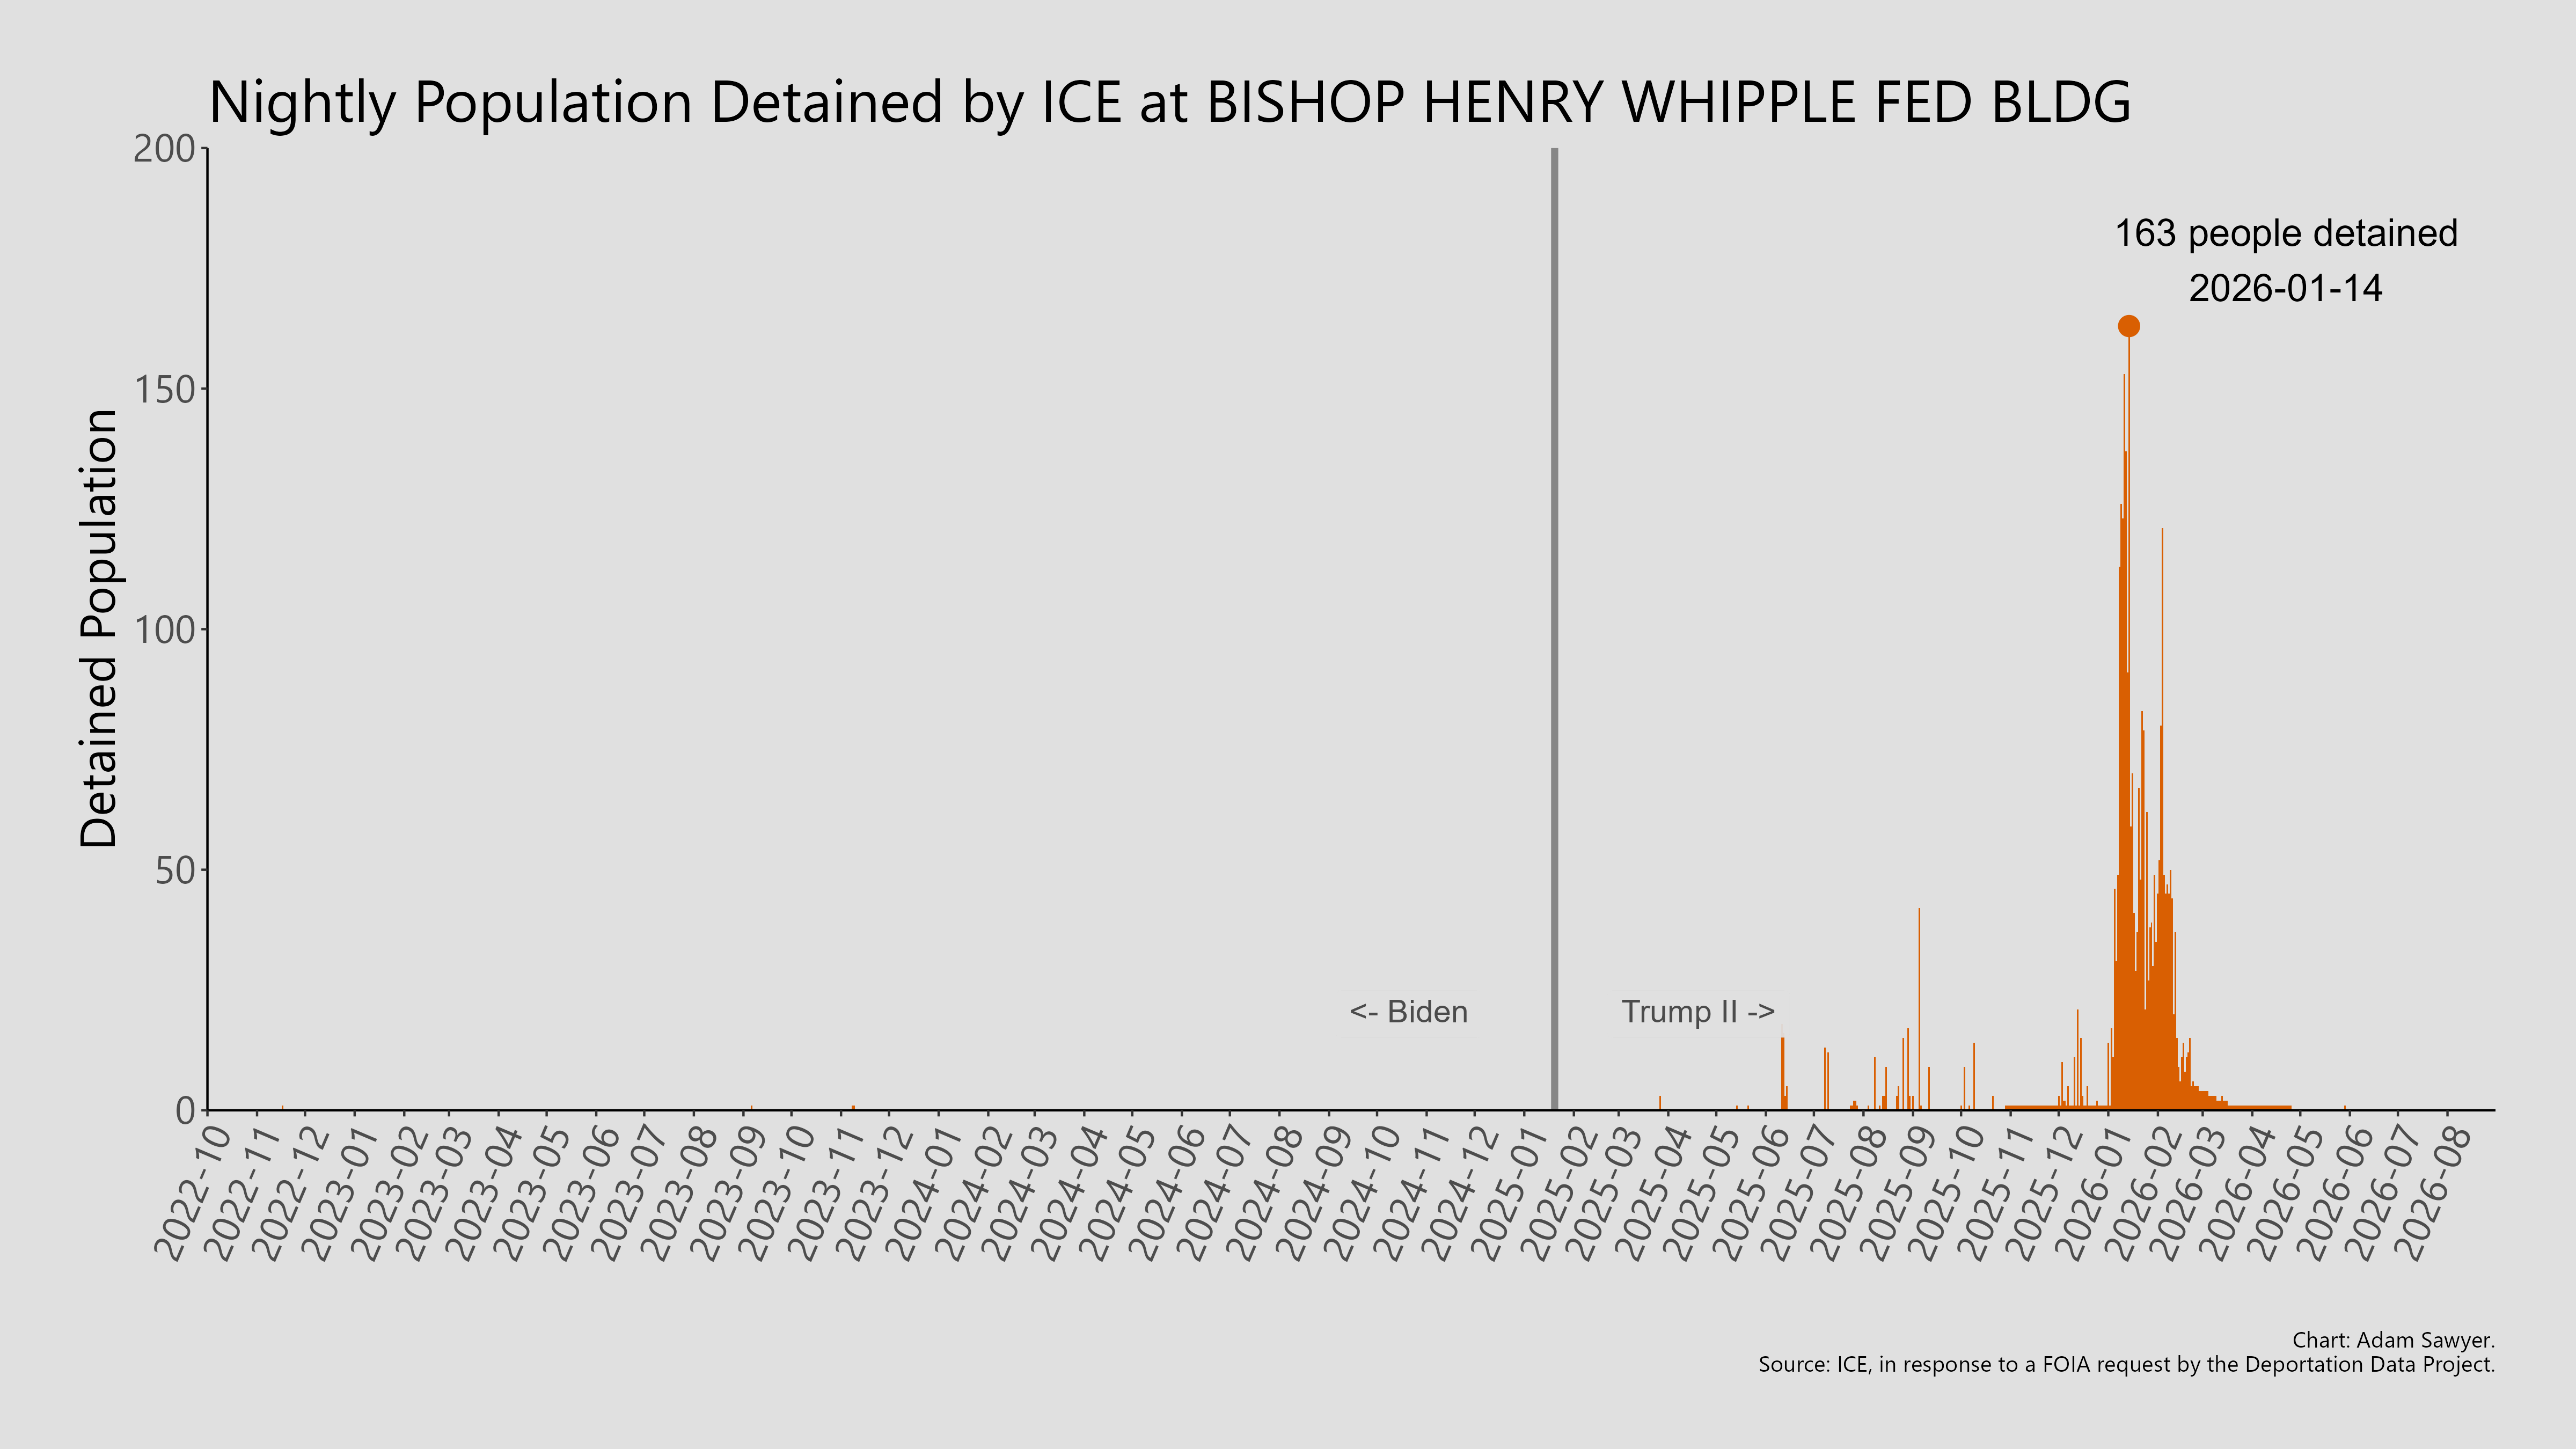
Each graph maps clearly onto a period in time when ICE concentrated activity in a metropolitan area of the United States.
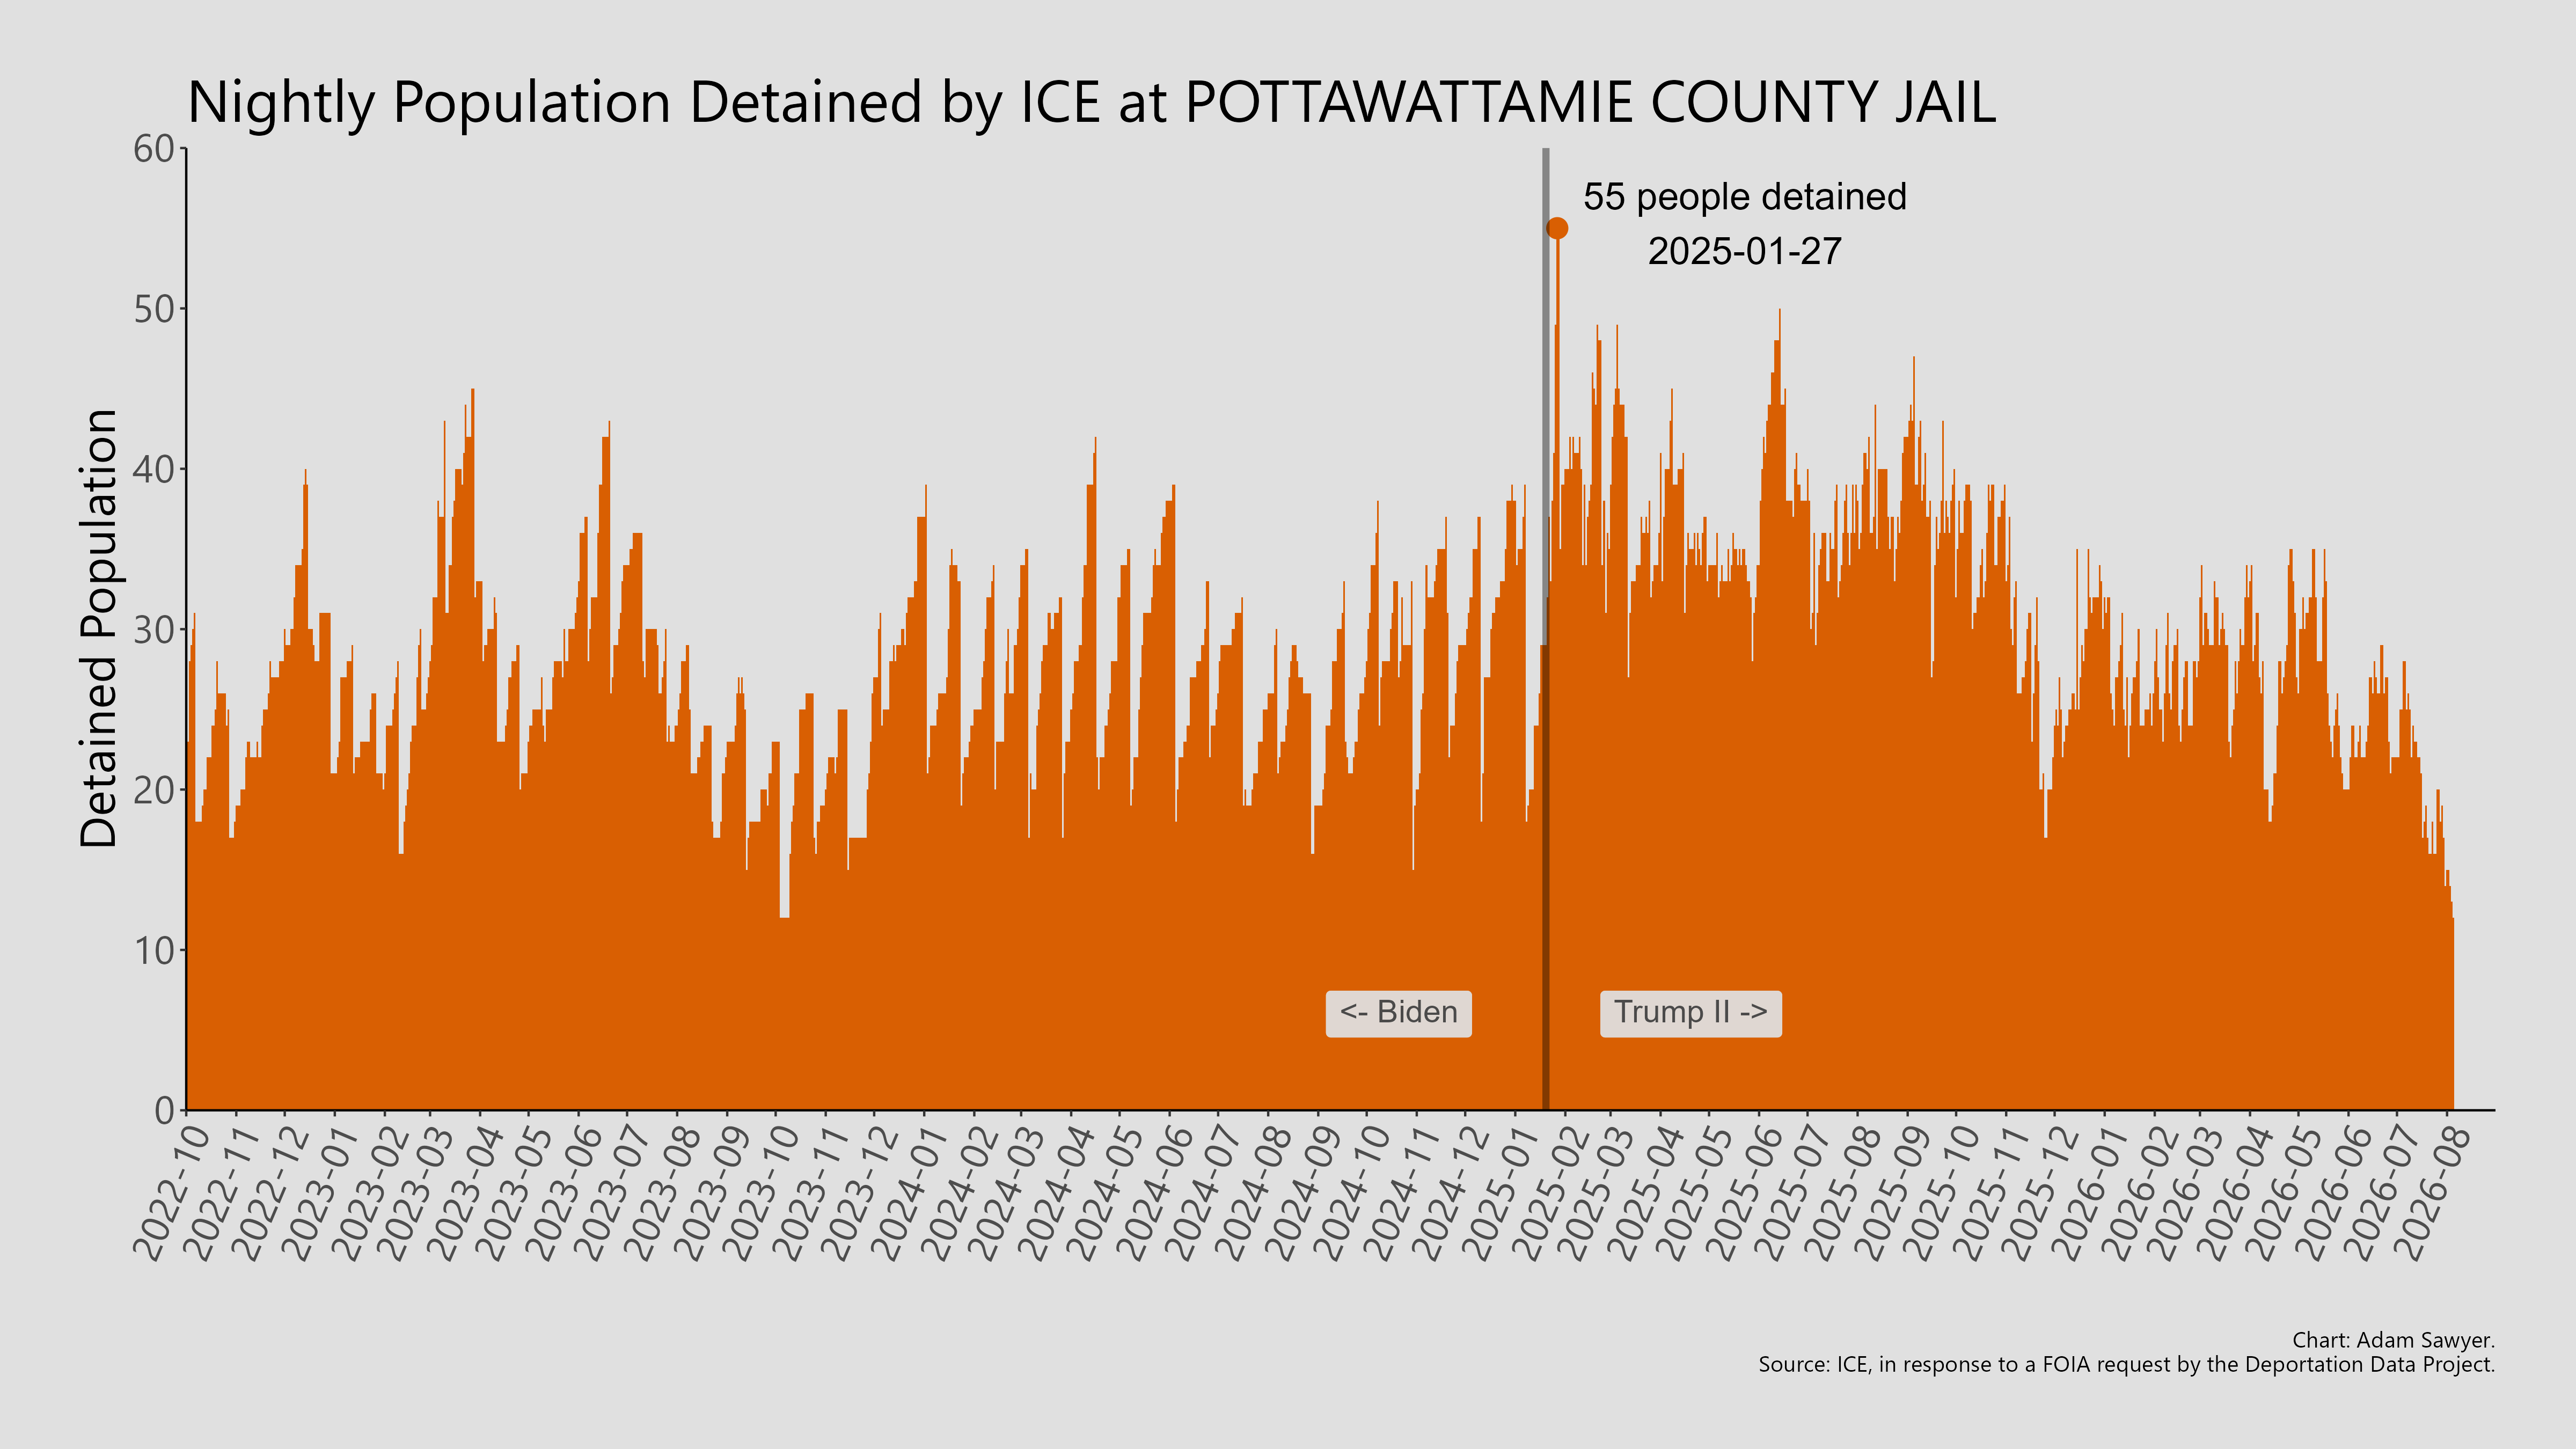
In less urban regions, the first book in frequently occurs at a county jail. Some county jails show clear periodicity. The detained population increases and then decreases over very similar intervals of time. This suggests that ICE fills these facilities to a contracted capacity before transporting (“shuffling”) detainees to a different, frequently larger detention center.
Pottawattamie County Jail in Council Bluffs, Iowa is an illustrative example of this dynamic.
Sometimes it happens in a matter of hours, other times it takes weeks, but ICE typically moves people from smaller facilities to larger ones over the course of a detention “stay.” The facility with the largest present capacity is Camp East Montana in El Paso, Texas.4
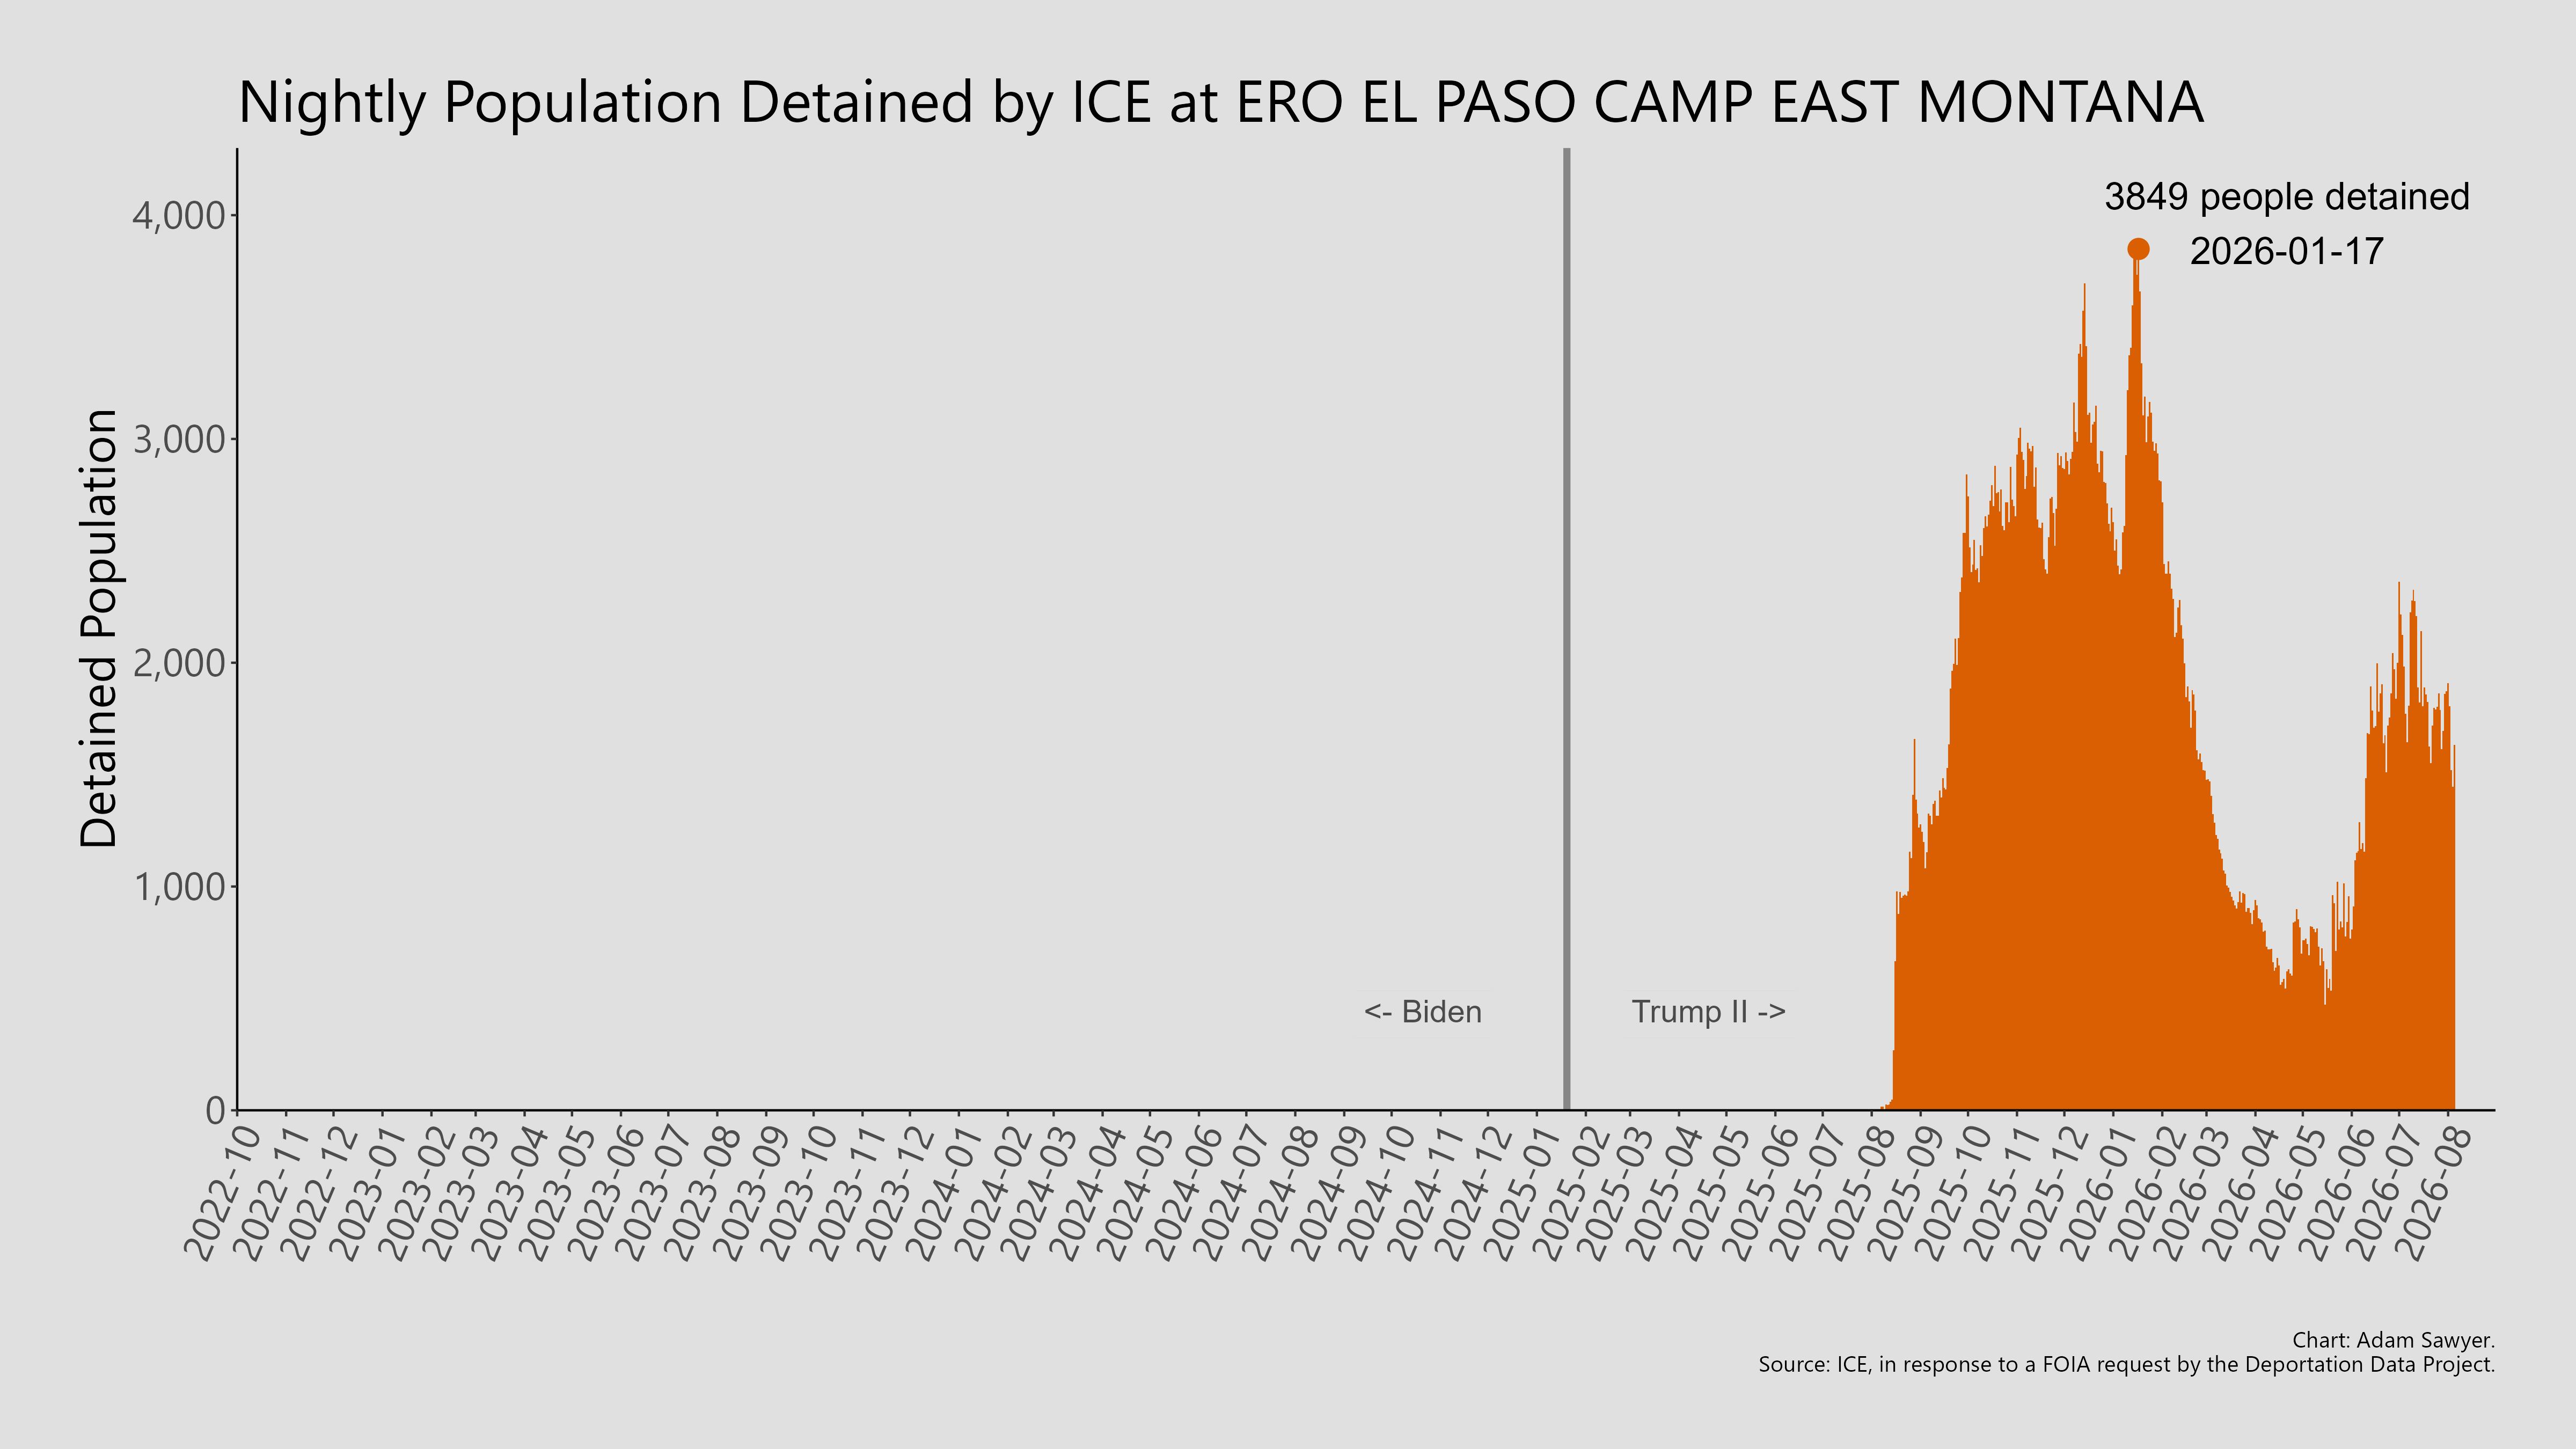
Before the camp experienced outbreaks of measles and tuberculosis, ICE held nearly 4,000 people at Camp East Montana. The public health emergencies forced ICE to relocate individuals to other detention centers, but over the past few months, ICE has increased the number of individuals held at the camp in parallel with the national enforcement surge.
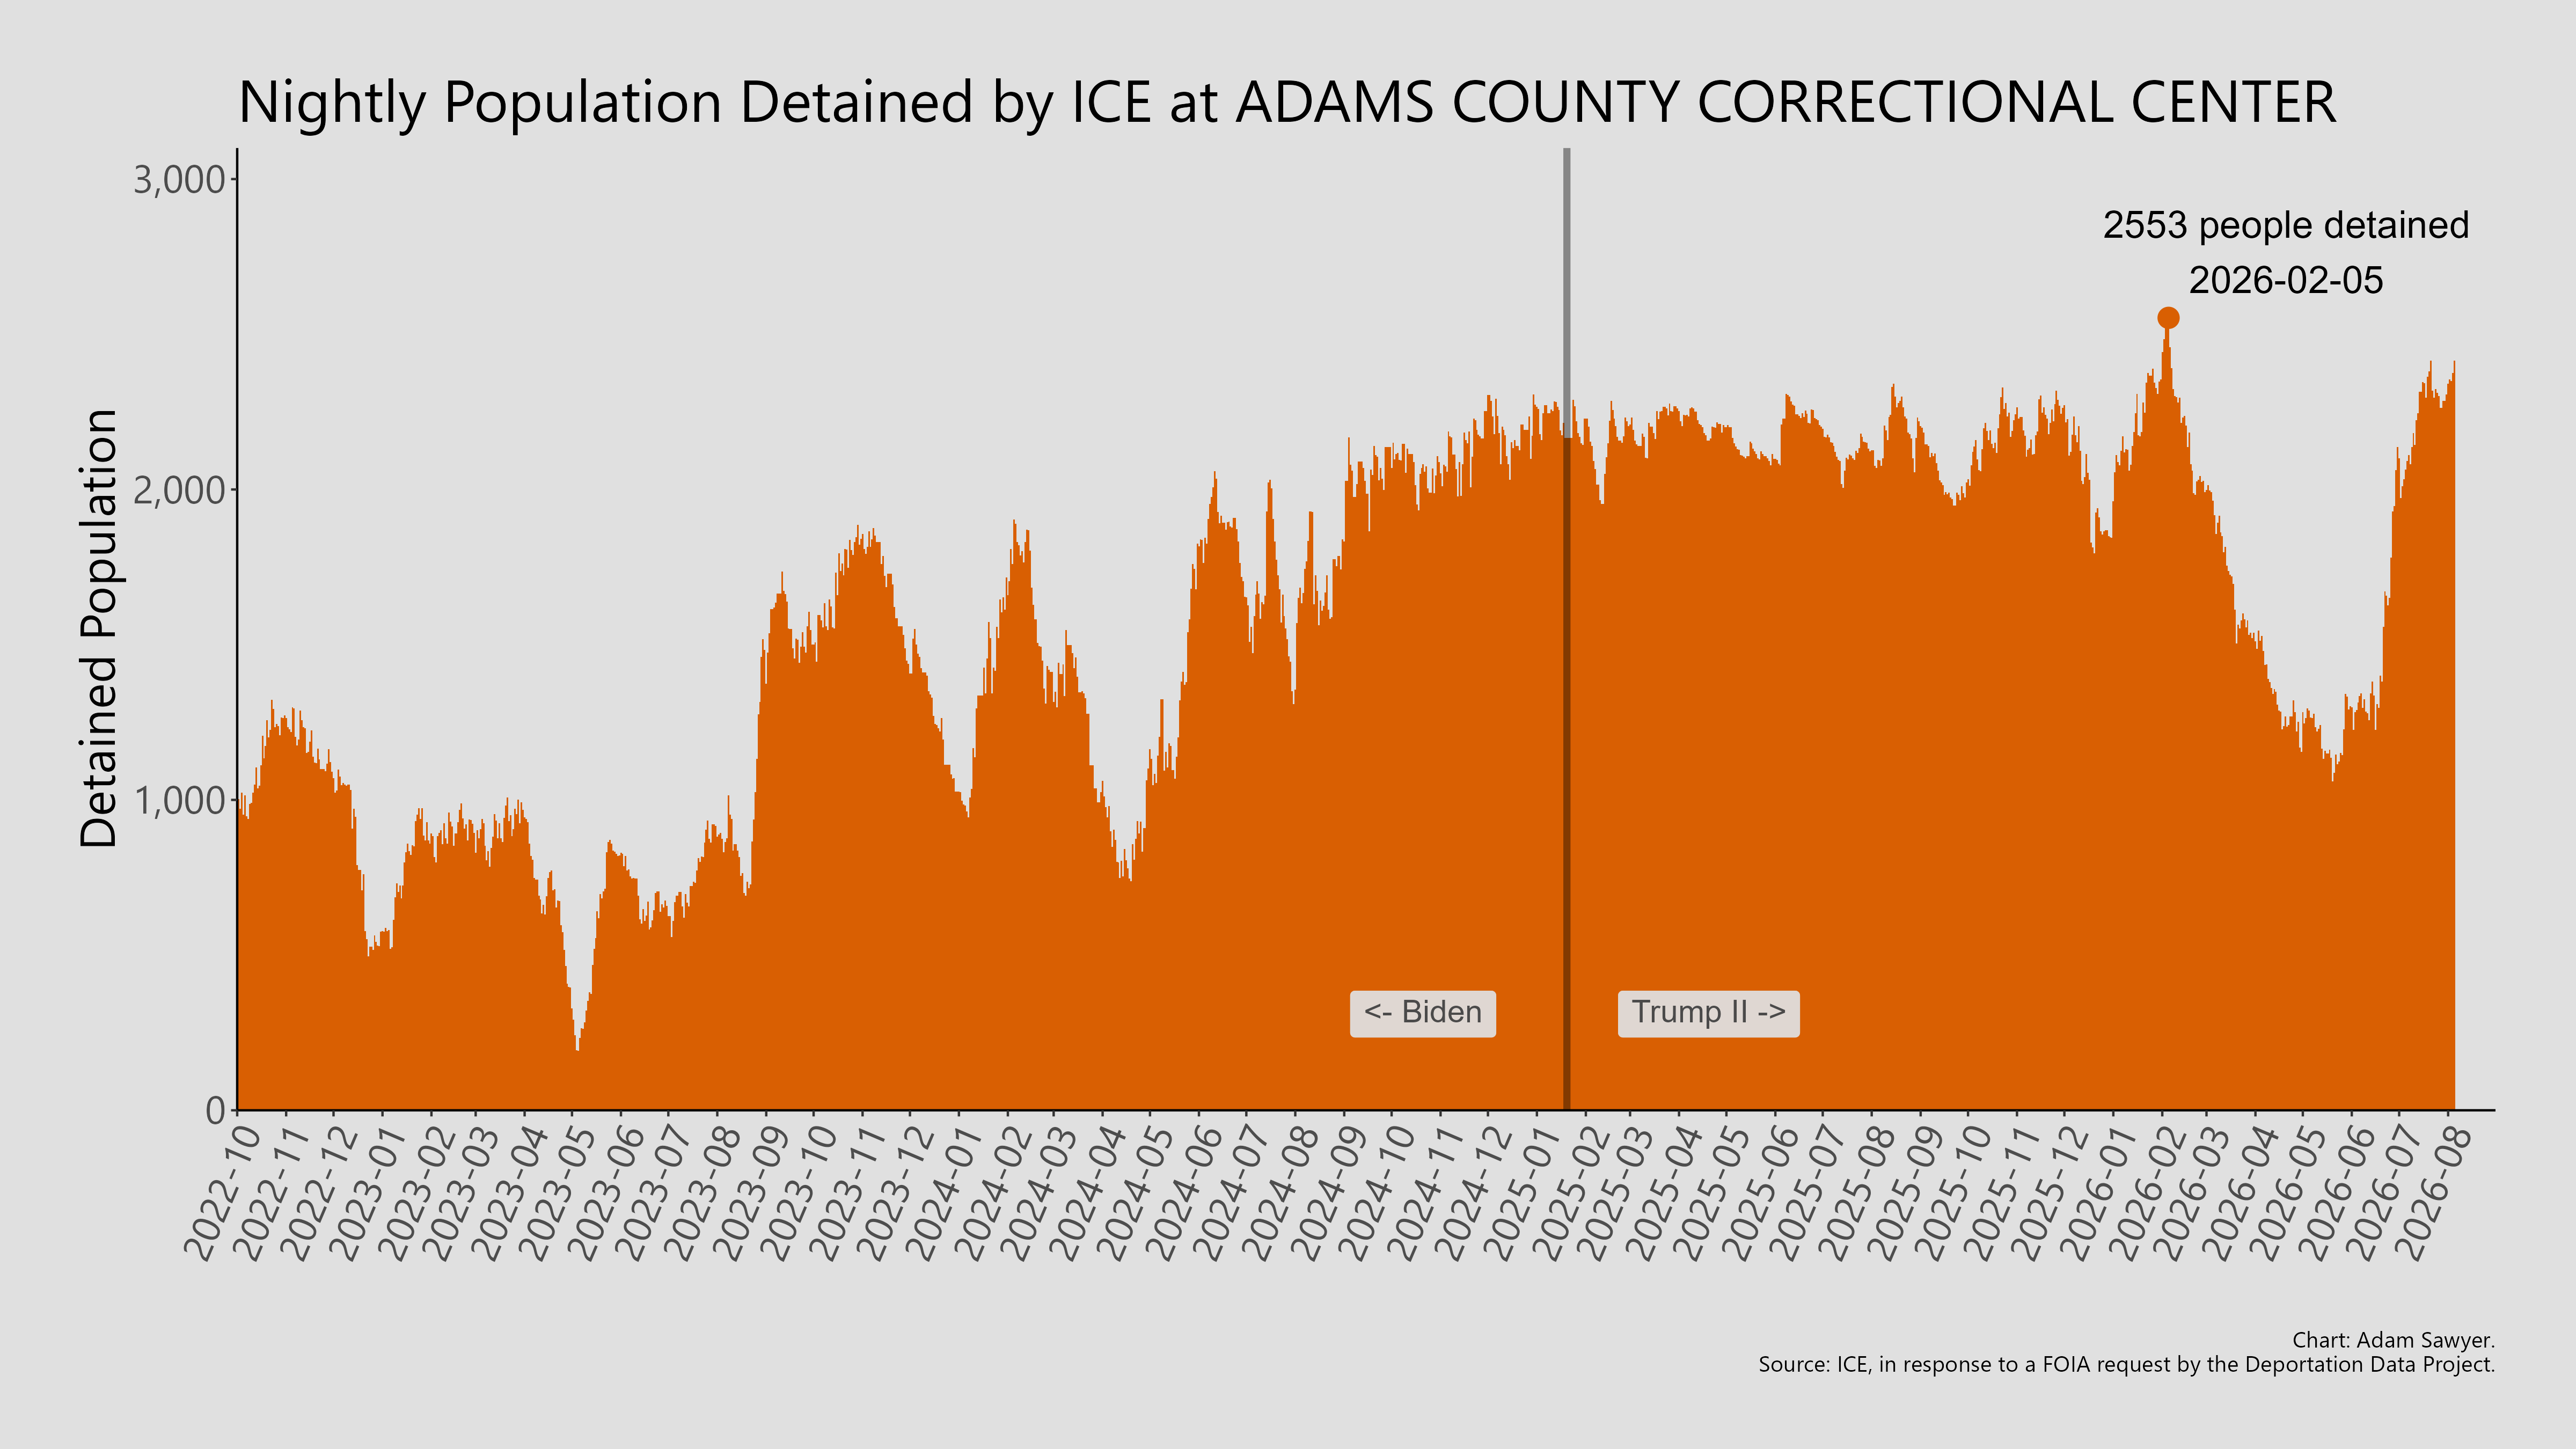
The largest facility by population as of right now is likely Adams County Correctional Center in Natchez, Mississippi. Over 2,400 people were detained there on the night of August 5.
The fastest growing detention site over the last calendar year is Diamondback Correctional Facility in Watonga, Oklahoma.
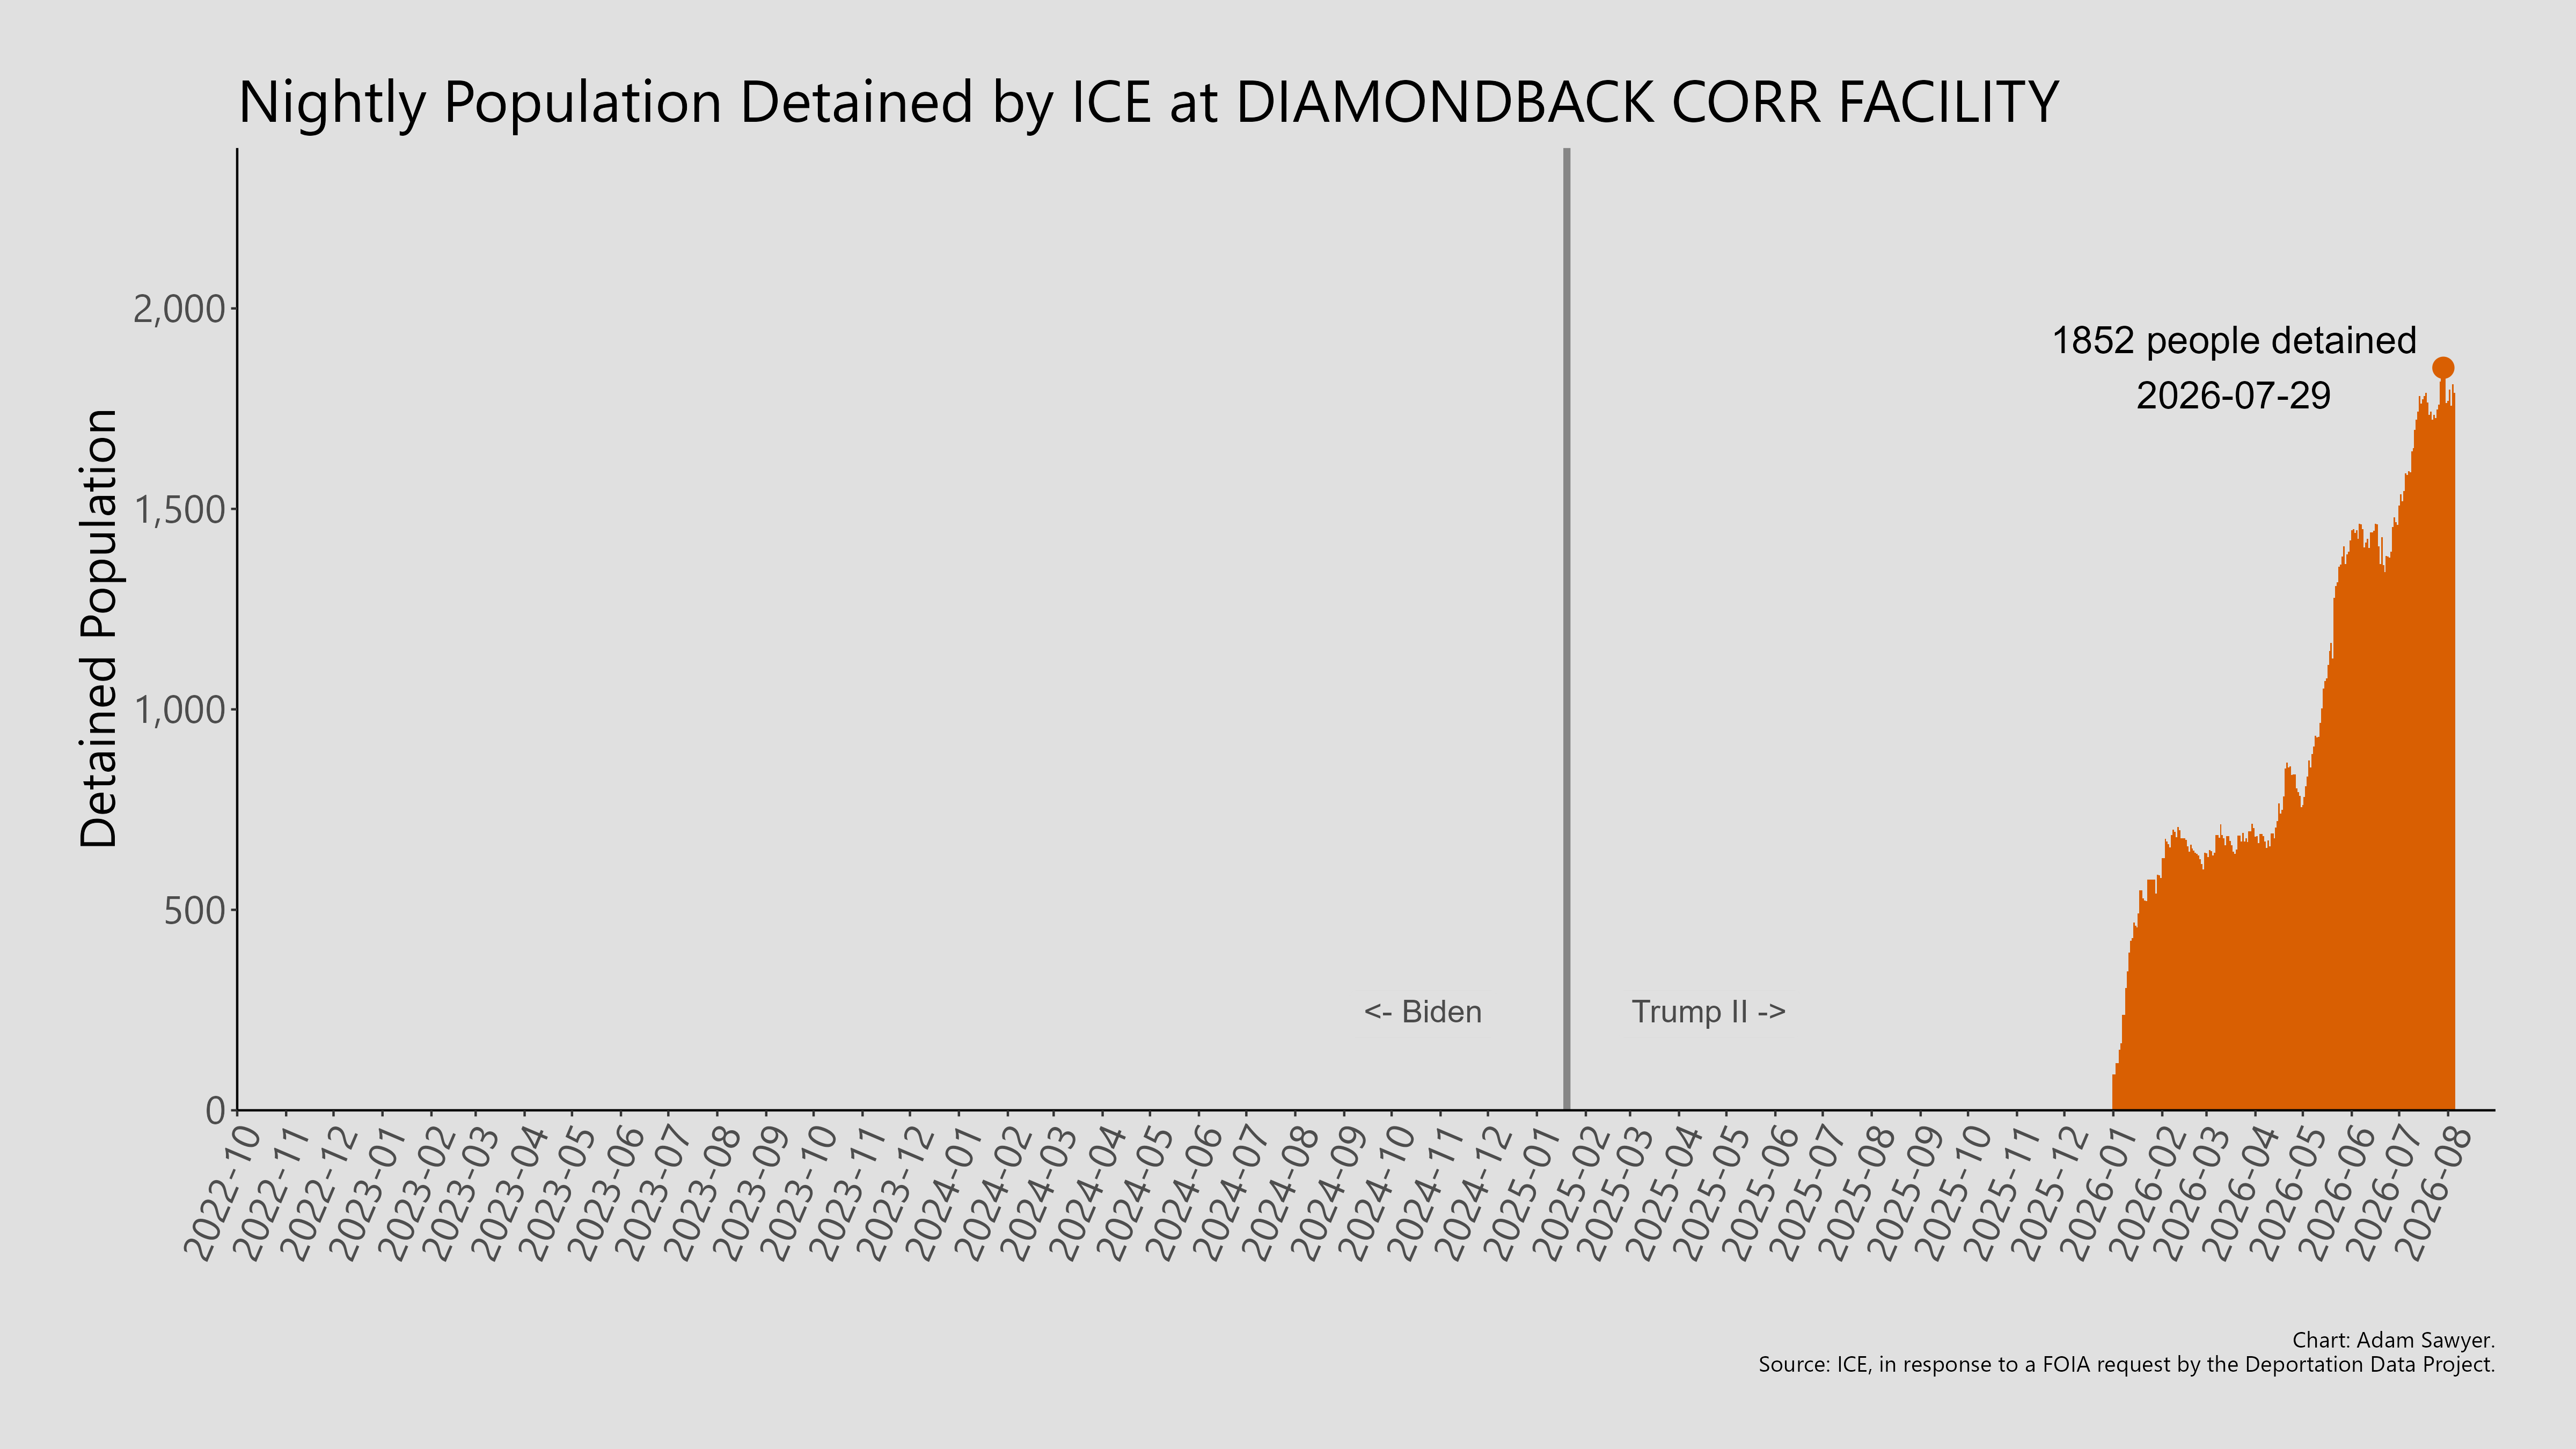
Since opening in January, it has become the second-largest camp by population in the United States with nearly 1,800 people held overnight.
Staging facilities are typically the final book in location before an ICE removal. They are also the locations where ICE has detained the most people in total over time.
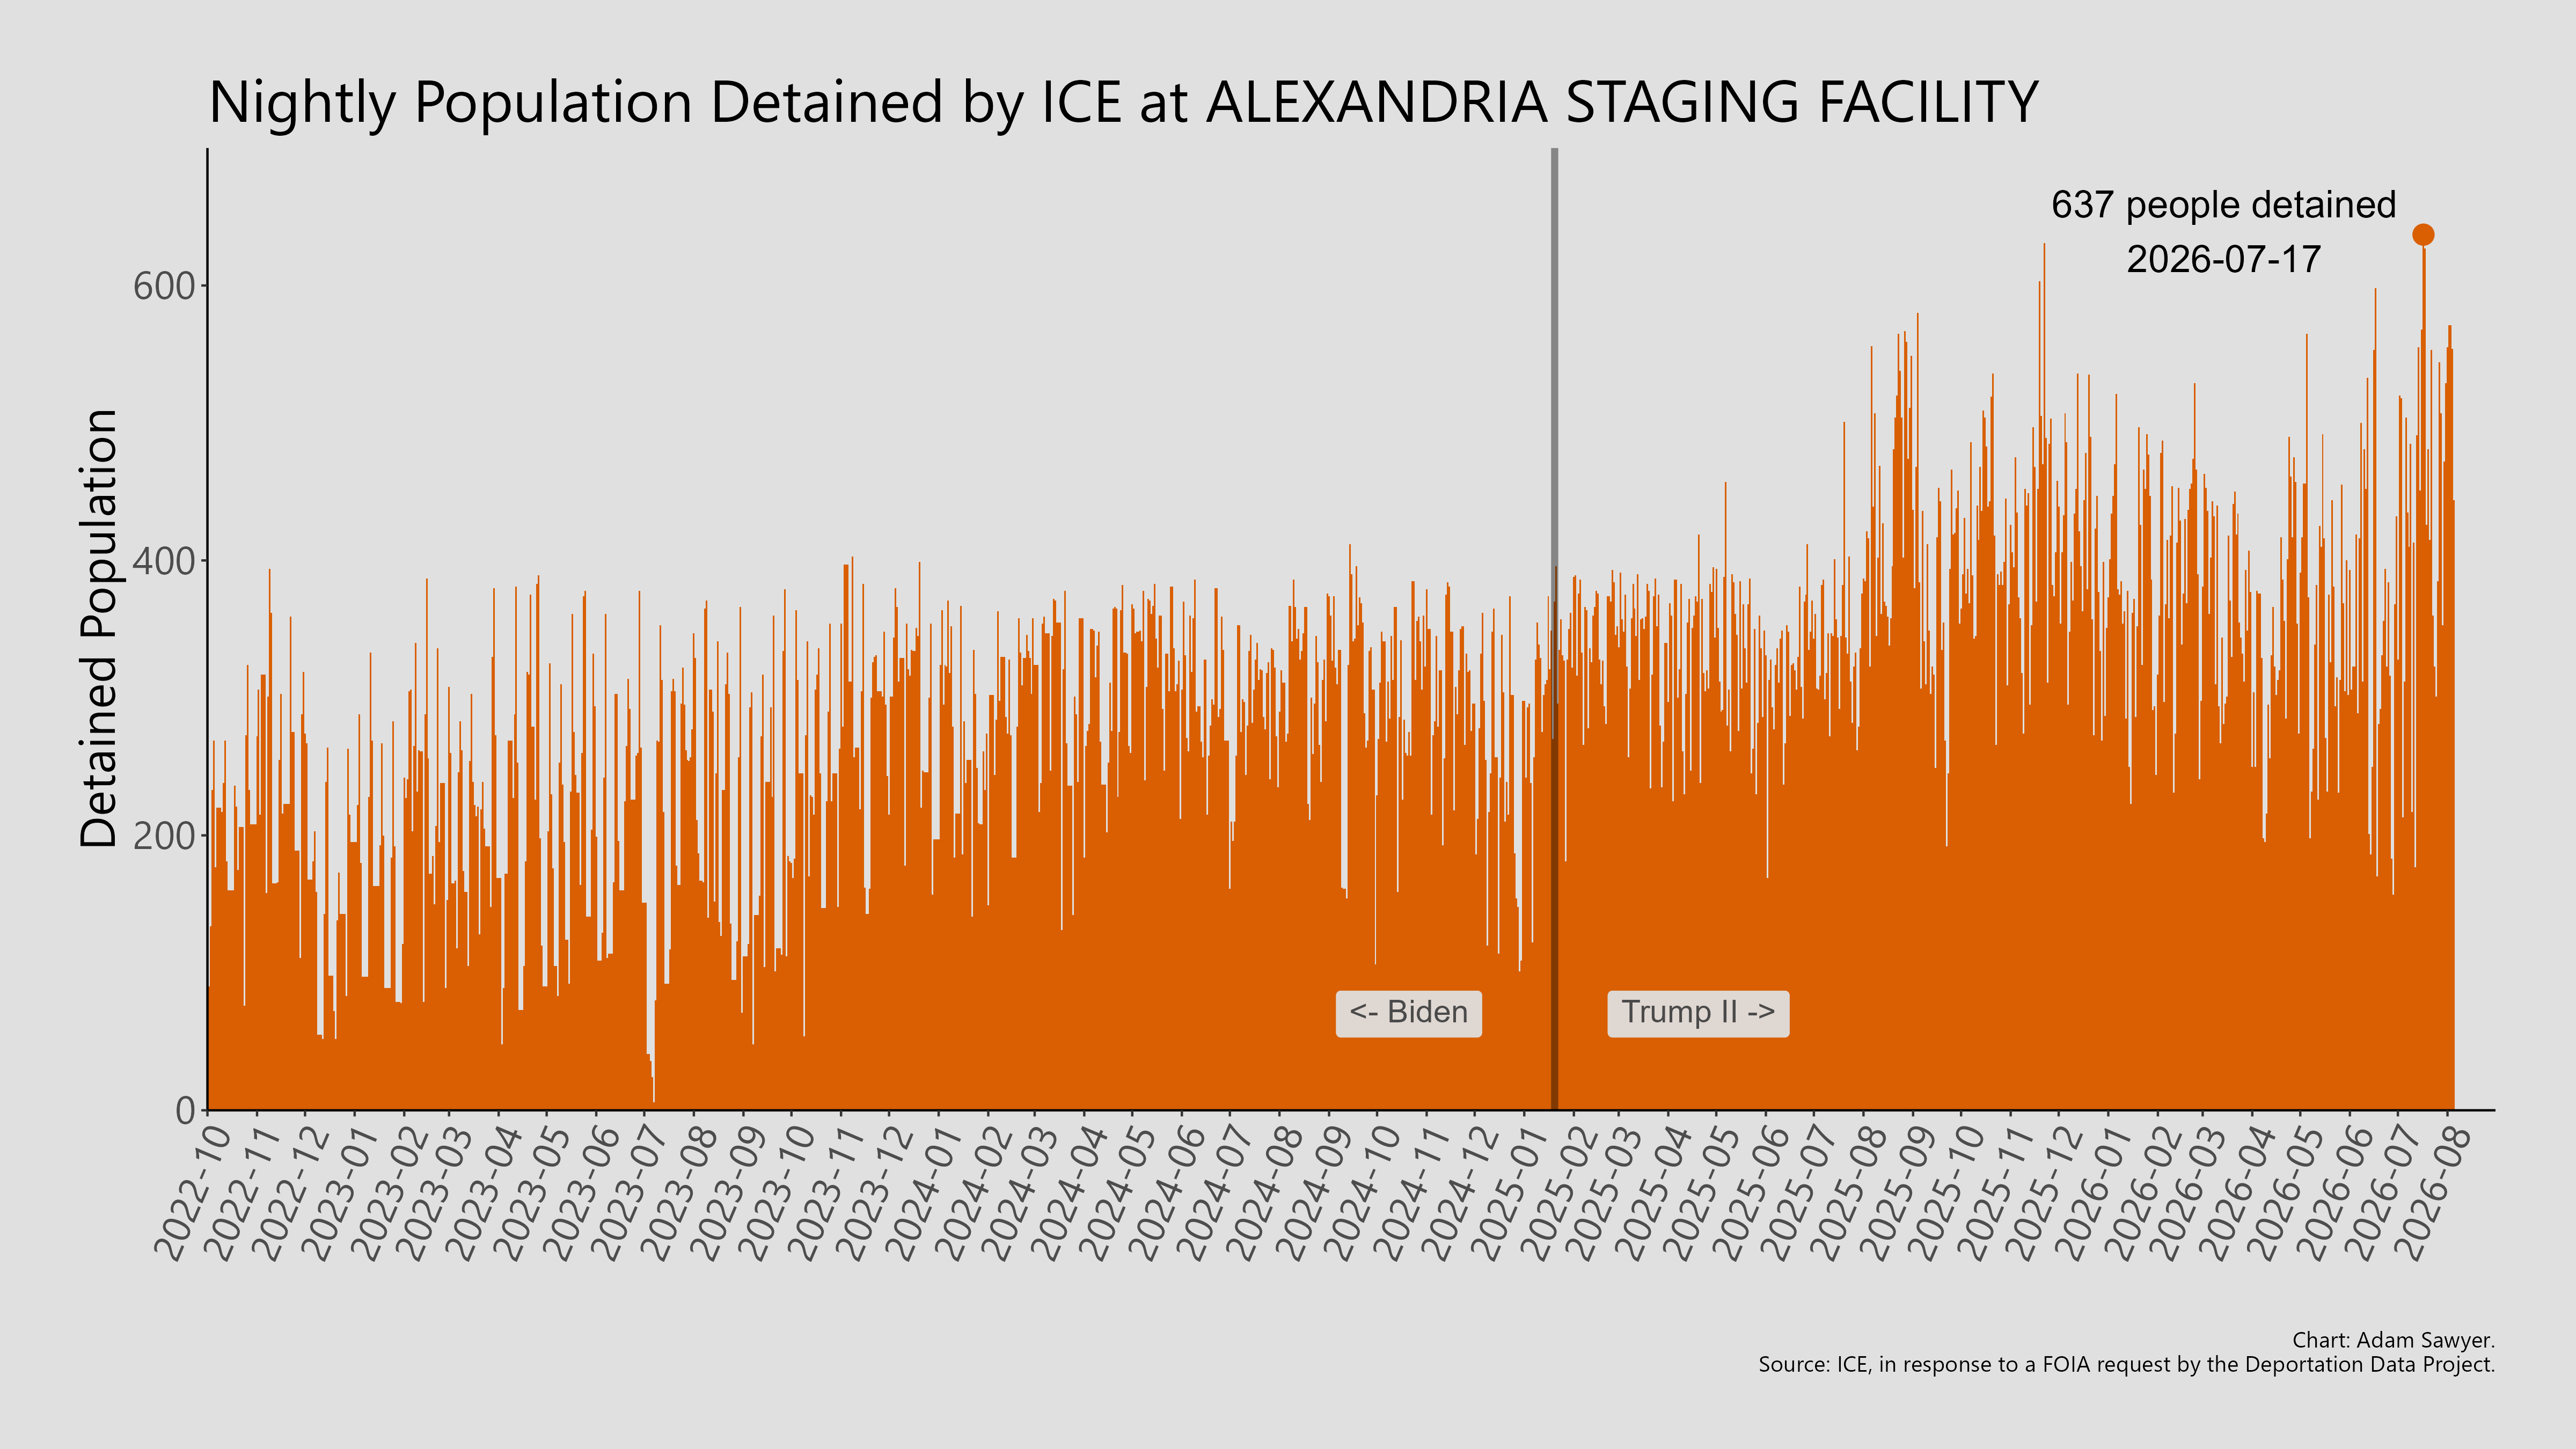
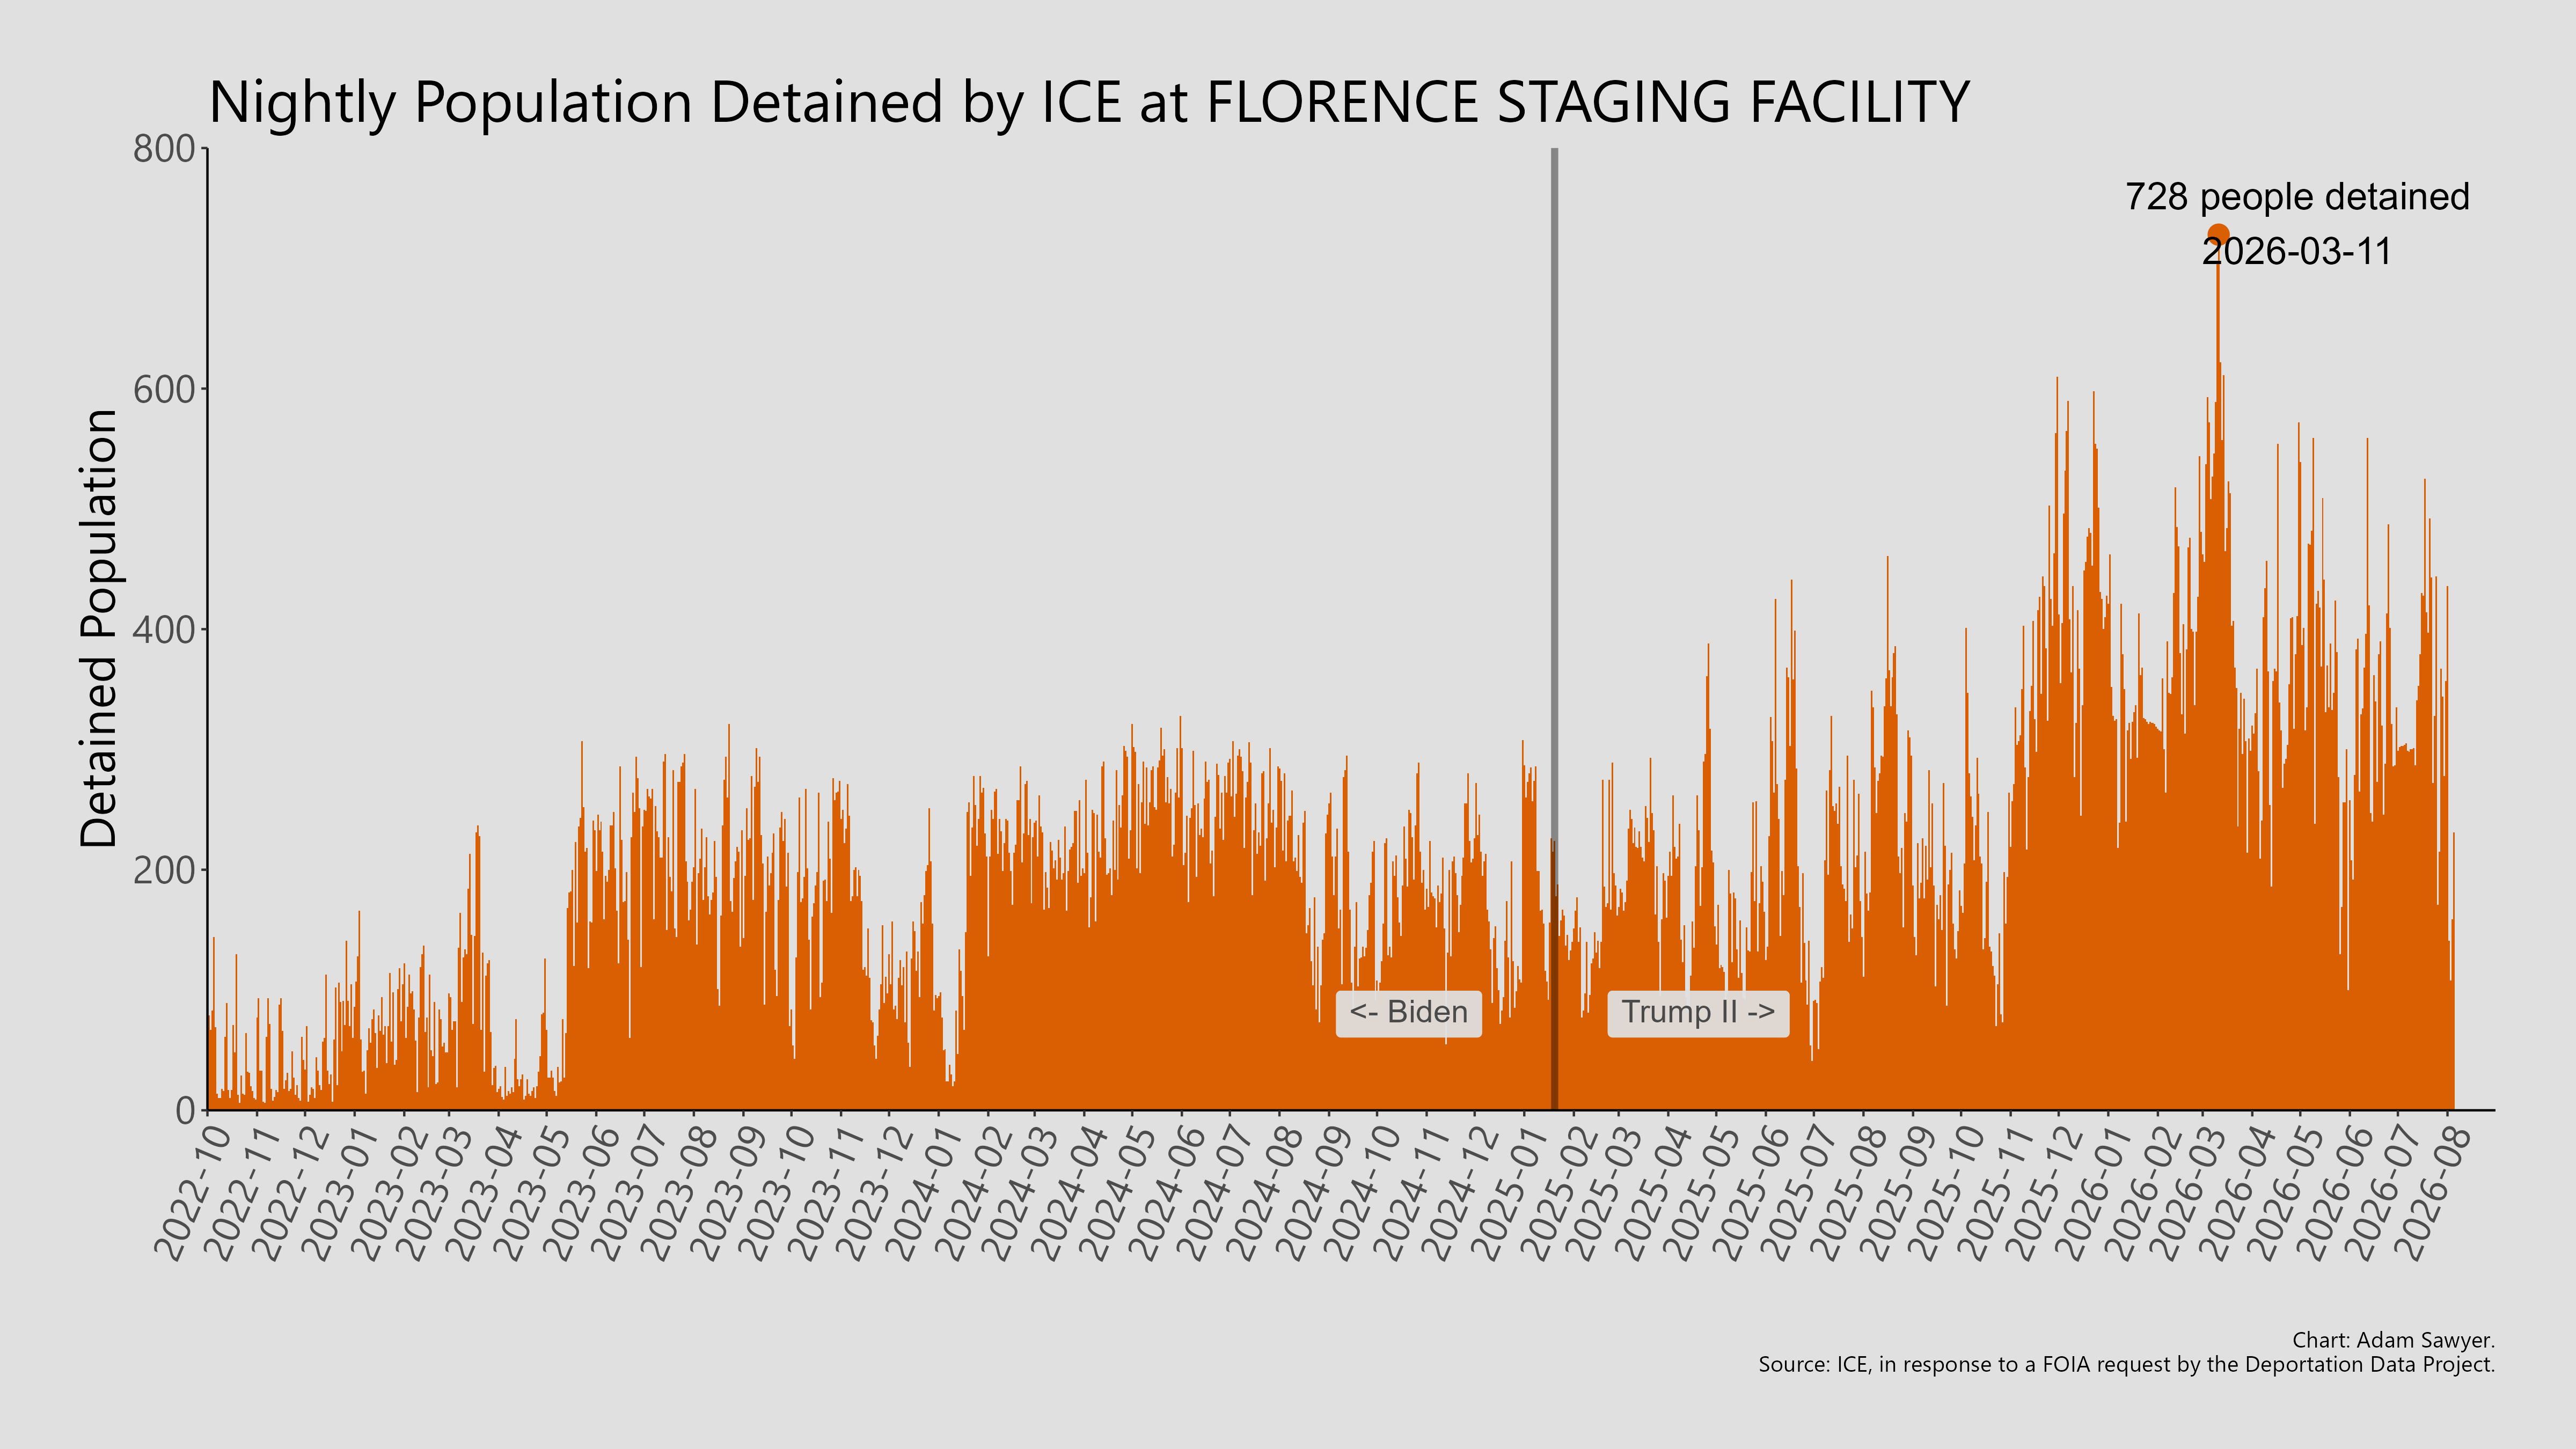
As referenced above, you can see all 599 charts here.
If you have questions, comments, or want to merely compare notes, you can reach me at adam@relevant-research.com. If you see something amiss, please reach out. Any errors are my own.
Footnotes
Some of these numbers might differ slightly from those reported from other analyses as there is a certain amount of interpretation when you get into the nitty-gritty of administrative case records processing. To wit, how does one handle the combination of 1) duplicate records and 2) book in events without an anonymized unique identifier code? Regarding the duplicates issue, the ICE book ins data include duplicate records entries when an individual’s bond amount changes. For the issue of the identifier, out of more than 3.2 million detention book in records, there are 10,558 records with no anonymized unique identifier. Since it can be difficult to parse which of these are the same individual and which are duplicates, handling these records can lead to minor differences (<1% of national totals) between counts.↩︎
Check out my notes in my previous post here for more information.↩︎
Just going to note here that people can stay up-to-date on ICE detention information in between the releases of ICE case records. Go to DetentionReports.com for information about facilities presented in a wiki-like format.↩︎
I’m mindful that some readers might prefer to call these concentration camps and not facilities. I would agree with many readers depending on which location we are talking about.↩︎